转自: https://blog.csdn.net/dapangzao/article/details/74949541
本文讲述对MPAndroidChart的使用,大部分是从其文档中摘录过来的。版本3.0.2
一、MPAndroidChart
概述
MPAndroidChart 是一款专门用于Android绘制图表的库,相当强大,当然也有IOS的版本。GitHub上地址:Git-MPAndroidChart 。 其特点如下:
- 支持8中不同图表类型
- 支持轴上的缩放
- 可拖动、平移
- 可定制轴
- 可突出选中的值(瞄准点及弹出pop)
- 定制图例
- 动画显示
- 其他
下面来详细介绍其使用,涉及到的MPAndroidChart名称都用MP简称来代替。
二、基本使用
1.添加依赖
在project的build.gradle中添加依赖:
allprojects {
repositories {
maven { url “https://jitpack.io” }
}
}
在app的build.gradle中添加依赖:
dependencies {
compile ‘com.github.PhilJay:MPAndroidChart:v3.0.2’
}
2.布局
在布局文件中使用需要的图表,并在代码中获取实例。
<com.github.mikephil.charting.charts.LineChart
    android:id="@+id/chart"
    android:layout_width="match_parent"
    android:layout_height="match_parent" />
3.添加数据
首先将数据集合转换成MP需要的数据集合,然后创建DataSet,DataSet保存某个数据集(比如某条曲线),可以定制需要的样式,比如曲线颜色,图例等。最后,添加数据集到LineData中,LineData存放所有的数据,也可以定制样式。
YourData[] dataObjects = ...;
List<Entry> entries = new ArrayList<Entry>();
for (YourData data : dataObjects) {
    entries.add(new Entry(data.getValueX(), data.getValueY()));
}
LineDataSet dataSet = new LineDataSet(entries, "Lable");
dataSet.setColor(...);
...
LineData lineData = new LineData(dataSet);
chart.setData(lineData);
chart.invalidate();
这里要根据不同的表格使用不同的实体类,比如,LineChart使用Entry类,BarChart使用BarEntry类等等。
三、api参考
本来想分模块写的,但是貌似太多了,就放到一个类里了,可能有些用不到,需要时请参考自行定制:
public void showChart() {
// *************************数据转换********************* //
float[] dataObjects = {1, 2, 3, 4, 5, 6, 7, 6, 5, 4, 3, 2, 1};
List<Entry> entries = new ArrayList<>();
for (int i = 0; i < dataObjects.length; i++) {
float data = dataObjects[i];
entries.add(new Entry(i, data));
}
LineDataSet dataSet = new LineDataSet(entries, "Label1");
dataSet.setColors(Color.BLACK, Color.GRAY, Color.RED, Color.GREEN); // 每个点之间线的颜色,还有其他几个方法,自己看
dataSet.setValueFormatter(new IValueFormatter() { // 将值转换为想要显示的形式,比如,某点值为1,变为“1¥”,MP提供了三个默认的转换器,
// LargeValueFormatter:将大数字变为带单位数字;PercentFormatter:将值转换为百分数;StackedValueFormatter,对于BarChart,是否只显示最大值图还是都显示
@Override
public String getFormattedValue(float value, Entry entry, int dataSetIndex, ViewPortHandler viewPortHandler) {
return value + "¥";
}
});
LineData lineData = new LineData(dataSet);
/*List<ILineDataSet> sets = new ArrayList<>(); // 多条线
sets.add(dataSet);
sets.add(dataSet1);
sets.add(dataSet2);
LineData lineData = new LineData(sets);
*/
mLineChart.setData(lineData);
// **************************图表本身一般样式**************************** //
mLineChart.setBackgroundColor(Color.WHITE); // 整个图标的背景色
// mLineChart.setContentDescription("××表"); // 右下角的描述文本,测试并不显示
Description description = new Description(); // 这部分是深度定制描述文本,颜色,字体等
description.setText("××表");
description.setTextColor(Color.RED);
mLineChart.setDescription(description);
mLineChart.setNoDataText("暂无数据"); // 没有数据时样式
mLineChart.setDrawGridBackground(false); // 绘制区域的背景(默认是一个灰色矩形背景)将绘制,默认false
mLineChart.setGridBackgroundColor(Color.WHITE); // 绘制区域的背景色
mLineChart.setDrawBorders(false); // 绘制区域边框绘制,默认false
mLineChart.setBorderColor(Color.GREEN); // 边框颜色
mLineChart.setBorderWidth(2); // 边框宽度,dp
mLineChart.setMaxVisibleValueCount(14); // 数据点上显示的标签,最大数量,默认100。且dataSet.setDrawValues(true);必须为true。只有当数据数量小于该值才会绘制标签
// *********************滑动相关*************************** //
mLineChart.setTouchEnabled(true); // 所有触摸事件,默认true
mLineChart.setDragEnabled(true); // 可拖动,默认true
mLineChart.setScaleEnabled(true); // 两个轴上的缩放,X,Y分别默认为true
mLineChart.setScaleXEnabled(true); // X轴上的缩放,默认true
mLineChart.setScaleYEnabled(true); // Y轴上的缩放,默认true
mLineChart.setPinchZoom(true); // X,Y轴同时缩放,false则X,Y轴单独缩放,默认false
mLineChart.setDoubleTapToZoomEnabled(true); // 双击缩放,默认true
mLineChart.setDragDecelerationEnabled(true); // 抬起手指,继续滑动,默认true
mLineChart.setDragDecelerationFrictionCoef(0.9f); // 摩擦系数,[0-1],较大值速度会缓慢下降,0,立即停止;1,无效值,并转换为0.9999.默认0.9f.
mLineChart.setOnChartGestureListener(new OnChartGestureListener() { // 手势监听器
@Override
public void onChartGestureStart(MotionEvent me, ChartTouchListener.ChartGesture lastPerformedGesture) {
// 按下
}
@Override
public void onChartGestureEnd(MotionEvent me, ChartTouchListener.ChartGesture lastPerformedGesture) {
// 抬起,取消
}
@Override
public void onChartLongPressed(MotionEvent me) {
// 长按
}
@Override
public void onChartDoubleTapped(MotionEvent me) {
// 双击
}
@Override
public void onChartSingleTapped(MotionEvent me) {
// 单击
}
@Override
public void onChartFling(MotionEvent me1, MotionEvent me2, float velocityX, float velocityY) {
// 甩动
}
@Override
public void onChartScale(MotionEvent me, float scaleX, float scaleY) {
// 缩放
}
@Override
public void onChartTranslate(MotionEvent me, float dX, float dY) {
// 移动
}
});
// ************************高亮*************************** //
mLineChart.setHighlightPerDragEnabled(true); // 拖拽时能否高亮(十字瞄准触摸到的点),默认true
mLineChart.setHighlightPerTapEnabled(true); // 双击时能都高亮,默认true
mLineChart.setMaxHighlightDistance(500); // 最大高亮距离(dp),点击位置距离数据点的距离超过这个距离不会高亮,默认500dp
dataSet.setHighlightEnabled(true); // 能否高亮,默认true
dataSet.setDrawHighlightIndicators(true); // 画高亮指示器,默认true
dataSet.setDrawHorizontalHighlightIndicator(true); // 画水平高亮指示器,默认true
dataSet.setDrawVerticalHighlightIndicator(true); // 垂直方向高亮指示器,默认true
dataSet.setHighLightColor(Color.BLACK); // 高亮颜色,默认RGB(255, 187, 115)
mLineChart.highlightValue(1, 0); // 高亮指定值,可以指定数据集的值,还有其他几个重载方法
mLineChart.setOnChartValueSelectedListener(new OnChartValueSelectedListener() { // 值选择监听器
@Override
public void onValueSelected(Entry e, Highlight h) {
// 选中
}
@Override
public void onNothingSelected() {
// 未选中
}
});
// *************************轴****************************** //
// 由四个元素组成:
// 标签:即刻度值。也可以自定义,比如时间,距离等等,下面会说一下;
// 轴线:坐标轴;
// 网格线:垂直于轴线对应每个值画的轴线;
// 限制线:最值等线。
XAxis xAxis = mLineChart.getXAxis(); // 获取X轴
YAxis yAxis = mLineChart.getAxisLeft(); // 获取Y轴,mLineChart.getAxis(YAxis.AxisDependency.LEFT);也可以获取Y轴
mLineChart.getAxisRight().setEnabled(false); // 不绘制右侧的轴线
xAxis.setEnabled(true); // 轴线是否可编辑,默认true
xAxis.setDrawLabels(true); // 是否绘制标签,默认true
xAxis.setDrawAxisLine(true); // 是否绘制坐标轴,默认true
xAxis.setDrawGridLines(false); // 是否绘制网格线,默认true
xAxis.setAxisMaximum(10); // 此轴能显示的最大值;
xAxis.resetAxisMaximum(); // 撤销最大值;
xAxis.setAxisMinimum(1); // 此轴显示的最小值;
xAxis.resetAxisMinimum(); // 撤销最小值;
// yAxis.setStartAtZero(true); // 从0开始绘制。已弃用。使用setAxisMinimum(float);
// yAxis.setInverted(true); // 反转轴,默认false
yAxis.setSpaceTop(10); // 设置最大值到图标顶部的距离占所有数据范围的比例。默认10,y轴独有
// 算法:比例 = (y轴最大值 - 数据最大值)/ (数据最大值 - 数据最小值) ;
// 用途:可以通过设置该比例,使线最大最小值不会触碰到图标的边界。
// 注意:设置一条线可能不太好看,mLineChart.getAxisRight().setSpaceTop(34)也设置比较好;同时,如果设置最小值,最大值,会影响该效果
yAxis.setSpaceBottom(10); // 同上,只不过是最小值距离底部比例。默认10,y轴独有
// yAxis.setShowOnlyMinMax(true); // 没找到。。。,true, 轴上只显示最大最小标签忽略指定的数量(setLabelCount,如果forced = false).
yAxis.setLabelCount(4, false); // 纵轴上标签显示的数量,数字不固定。如果force = true,将会画出明确数量,但是可能值导致不均匀,默认(6,false)
yAxis.setPosition(YAxis.YAxisLabelPosition.OUTSIDE_CHART); // 标签绘制位置。默认再坐标轴外面
xAxis.setGranularity(1); // 设置X轴值之间最小距离。正常放大到一定地步,标签变为小数值,到一定地步,相邻标签都是一样的。这里是指定相邻标签间最小差,防止重复。
yAxis.setGranularity(1); // 同上
yAxis.setGranularityEnabled(false); // 是否禁用上面颗粒度限制。默认false
// 轴颜色
yAxis.setTextColor(Color.RED); // 标签字体颜色
yAxis.setTextSize(10); // 标签字体大小,dp,6-24之间,默认为10dp
yAxis.setTypeface(null); // 标签字体
yAxis.setGridColor(Color.GRAY); // 网格线颜色,默认GRAY
yAxis.setGridLineWidth(1); // 网格线宽度,dp,默认1dp
yAxis.setAxisLineColor(Color.RED); // 坐标轴颜色,默认GRAY.测试到一个bug,假如左侧线只有1dp,
// 那么如果x轴有线且有网格线,当刻度拉的正好位置时会覆盖到y轴的轴线,变为X轴网格线颜色,结局办法是,要么不画轴线,要么就是坐标轴稍微宽点
xAxis.setAxisLineColor(Color.RED);
yAxis.setAxisLineWidth(2); // 坐标轴线宽度,dp,默认1dp
yAxis.enableGridDashedLine(20, 10, 1); // 网格线为虚线,lineLength,每段实线长度,spaceLength,虚线间隔长度,phase,起始点(进过测试,最后这个参数也没看出来干啥的)
// 限制线
LimitLine ll = new LimitLine(6.5f, "上限"); // 创建限制线, 这个线还有一些相关的绘制属性方法,自行看一下就行,没多少东西。
yAxis.addLimitLine(ll); // 添加限制线到轴上
yAxis.removeLimitLine(ll); // 移除指定的限制线,还有其他的几个移除方法
yAxis.setDrawLimitLinesBehindData(false); // 限制线在数据之后绘制。默认为false
// X轴更多属性
xAxis.setLabelRotationAngle(45); // 标签倾斜
xAxis.setPosition(XAxis.XAxisPosition.BOTTOM); // X轴绘制位置,默认是顶部
// Y轴更多属性
dataSet.setAxisDependency(YAxis.AxisDependency.LEFT); // 设置dataSet应绘制在Y轴的左轴还是右轴,默认LEFT
yAxis.setDrawZeroLine(false); // 绘制值为0的轴,默认false,其实比较有用的就是在柱形图,当有负数时,显示在0轴以下,其他的图这个可能会看到一些奇葩的效果
yAxis.setZeroLineWidth(10); // 0轴宽度
yAxis.setZeroLineColor(Color.BLUE); // 0轴颜色
// 轴值转换显示
xAxis.setValueFormatter(new IAxisValueFormatter() { // 与上面值转换一样,这里就是转换出轴上label的显示。也有几个默认的,不多说了。
@Override
public String getFormattedValue(float value, AxisBase axis) {
return value + "℃";
}
});
// *********************图例***************************** //
Legend legend = mLineChart.getLegend(); // 获取图例,但是在数据设置给chart之前是不可获取的
legend.setEnabled(true); // 是否绘制图例
legend.setTextColor(Color.GRAY); // 图例标签字体颜色,默认BLACK
legend.setTextSize(12); // 图例标签字体大小[6,24]dp,默认10dp
legend.setTypeface(null); // 图例标签字体
legend.setWordWrapEnabled(false); // 当图例超出时是否换行适配,这个配置会降低性能,且只有图例在底部时才可以适配。默认false
legend.setMaxSizePercent(1f); // 设置,默认0.95f,图例最大尺寸区域占图表区域之外的比例
legend.setPosition(Legend.LegendPosition.BELOW_CHART_LEFT); // 图例显示位置,已弃用
legend.setForm(Legend.LegendForm.CIRCLE); // 设置图例的形状,SQUARE, CIRCLE 或者 LINE
legend.setFormSize(8); // 图例图形尺寸,dp,默认8dp
legend.setXEntrySpace(6); // 设置水平图例间间距,默认6dp
legend.setYEntrySpace(0); // 设置垂直图例间间距,默认0
legend.setFormToTextSpace(5); // 设置图例的标签与图形之间的距离,默认5dp
legend.setWordWrapEnabled(true); // 图标单词是否适配。只有在底部才会有效,
legend.setCustom(new LegendEntry[]{new LegendEntry("label1", Legend.LegendForm.CIRCLE, 10, 5, null, Color.RED),
new LegendEntry("label2", Legend.LegendForm.CIRCLE, 10, 5, null, Color.GRAY),
new LegendEntry("label3", Legend.LegendForm.CIRCLE, 10, 5, null, Color.RED)}); // 这个应该是之前的setCustom(int[] colors, String[] labels)方法
// 这个方法会把前面设置的图例都去掉,重置为指定的图例。
legend.resetCustom(); // 去掉上面方法设置的图例,然后之前dataSet中设置的会重新显示。
// legend.setExtra(new int[]{Color.RED, Color.GRAY, Color.GREEN}, new String[]{"label1", "label2", "label3"}); // 添加图例,颜色与label数量要一致。
// 如果前面已经在dataSet中设置了颜色,那么之前的图例就存在,这个只是添加在后面的图例,并不一定有对应数据。
mLineChart.invalidate(); // 重绘
// ********************其他******************************* //
mLineChart.setLogEnabled(false); // 是否打印日志,默认false
// mLineChart.notifyDataSetChanged(); // 通知有值变化,重绘,一般动态添加数据时用到
// ******************指定缩放显示范围************************* //
// 这里要说一下,下面并不是指定其初始显示的范围,所以,很可能大家觉得没有效果。其实这几个方法目的是限制缩放时的可见范围最值。
// mLineChart.setVisibleXRangeMaximum(6); // X轴缩小可见最大范围,这里测试有点问题,范围不是指定的,可以缩小到更多范围。
// mLineChart.setVisibleXRangeMinimum(4); // X轴放大最低可见范围,最小意思是,再怎么放大范围也至少要有4,但是一开始显示的时候范围可能很大。
// mLineChart.setVisibleYRangeMaximum(4, YAxis.AxisDependency.LEFT); // Y缩小时可见最大范围,后面是其适用的轴。测试发现两边轴都是有效的
// mLineChart.setVisibleYRangeMinimum(2, YAxis.AxisDependency.LEFT); // Y轴放大时可见最小范围。
// mLineChart.setVisibleYRange(3, 5, YAxis.AxisDependency.LEFT); // y轴缩放时可见最小和最大范围。但是测试发现不能放大3的范围,但是也是符合这个限制的
// mLineChart.setVisibleXRange(3, 6); // X轴缩放时可见最小和最大范围。测试也有点问题
// mLineChart.setViewPortOffsets(10, 0, 10, 0); // 图表绘制区的偏移量设置,这个会忽略MP的自动计算偏移。
// 比如,自动时,图例与绘制区是分开的,但是自己写就可能重和在一起。慎用
// mLineChart.resetViewPortOffsets(); // 重置上面的偏移量设置。
// mLineChart.setExtraOffsets(10, 0, 10, 0); // 这个与上面的区别是不会忽略其自己计算的偏移。
// **************************移动******************************** //
// mLineChart.fitScreen(); // 重置所有缩放与拖动,使图标完全符合其边界
// mLineChart.moveViewToX(30); // 想指定向偏移,比如原本显示前三个点,现在显示后三个,如果没有缩放其实看不出啥效果
// mLineChart.moveViewTo(30, 10, YAxis.AxisDependency.LEFT); // 向指定方向偏移,如果没有缩放其实看不出啥效果,后面的轴没啥效果
// mLineChart.moveViewToAnimated(30, 10, YAxis.AxisDependency.LEFT, 2000); // 同上面那个,但是有动画效果
// mLineChart.centerViewTo(30, 10, YAxis.AxisDependency.LEFT); // 将视图中心移动到指定位置,也是要缩放才有效果
// mLineChart.centerViewToAnimated(30, 10, YAxis.AxisDependency.LEFT, 2000); // 同上面那个,但是有动画效果
// ****************************自动缩放********************************** //
// 这里的缩放效果会收到setVisibleXRangeMaximum等范围影响,
// mLineChart.zoomIn(); // 自动放大1.4倍,没看出效果
// mLineChart.zoomOut(); // 自动缩小0.7倍,没看出效果
// mLineChart.zoom(2f, 2f, 2, 3, YAxis.AxisDependency.LEFT);
// mLineChart.zoomAndCenterAnimated(1.4f, 1.4f, 2, 3, YAxis.AxisDependency.LEFT, 3000); // 缩放,有动画,报了个空指针。。。
// ************************动画************************************** //
/*mLineChart.animateX(3000); // 数据从左到右动画依次显示
mLineChart.animateY(3000); // 数据从下到上动画依次显示*/
// mLineChart.animateXY(3000, 3000); // 上面两个的结合
mLineChart.animateX(3000, Easing.EasingOption.EaseInQuad); // 动画播放随时间变化的速率,有点像插值器。后面这个有的不能用
// **************************所有数据样式************************************ //
mLineChart.setMarker(new ChartMarkerView(this, R.layout.item_chart_indicator, "温度:", "℃")); // 点击数据点显示的pop,有俩默认的,MarkerImage:一张图片,MarkerView:一个layout布局,也可以自己定义.这里这个是我自定义的一个MarkerView。
lineData.setValueTextColor(Color.RED); // 该条线的
List<Integer> colors = new ArrayList<>();
colors.add(Color.BLACK);
colors.add(Color.GRAY);
colors.add(Color.RED);
colors.add(Color.GREEN);
lineData.setValueTextColors(colors); // 字体添加颜色,按顺序给数据上色,不足则重复使用,也可以在单个dataSet上添加
lineData.setValueTextSize(12); // 文字大小
lineData.setValueTypeface(null); // 文字字体
lineData.setValueFormatter(new IValueFormatter() { // 所有数据显示的数据值
@Override
public String getFormattedValue(float value, Entry entry, int dataSetIndex, ViewPortHandler viewPortHandler) {
return value + "¥";
}
});
lineData.setDrawValues(true); // 绘制每个点的值
// 上面这些都是data集合中的相关属性,也可以针对每个dataSet来设置
// **************************图表本身特殊样式******************************** //
mLineChart.setAutoScaleMinMaxEnabled(false); // y轴是否自动缩放;当缩放时,y轴的显示会自动根据x轴范围内数据的最大最小值而调整。财务报表比较有用,默认false
mLineChart.setKeepPositionOnRotation(false); // 设置当屏幕方向变化时,是否保留之前的缩放与滚动位置,默认:false
// *****************************其他的chart************************* //
// 下面只有barChart(柱状图)有用
BarChart mBarChart = (BarChart) findViewById(R.id.bc);
List<BarEntry> barEntries = new ArrayList<>();
barEntries.add(new BarEntry(0, 1));
barEntries.add(new BarEntry(1, 2));
barEntries.add(new BarEntry(2, 3));
barEntries.add(new BarEntry(3, -1));
BarDataSet iBarDataSet = new BarDataSet(barEntries, "bar label");
iBarDataSet.setColors(colors);
iBarDataSet.setValueTextColors(colors);
BarData barData = new BarData(iBarDataSet); // 可以添加多个set,即可化成group组
mBarChart.setData(barData);
// mBarChart.groupBars(1980f, 20, 0); // 设置group组间隔
mBarChart.setFitBars(true); // 在bar开头结尾两边添加一般bar宽的留白
mBarChart.setDrawValueAboveBar(false); // 所有值都绘制在柱形外顶部,而不是柱形内顶部。默认true
mBarChart.setDrawBarShadow(false); // 柱形阴影,一般有值被绘制,但是值到顶部的位置为空,这个方法设置也画这部分,但是性能下降约40%,默认false
// setDrawValuesForWholeStack(boolean enabled); // 没有该方法。。。是否绘制堆积的每个值,还是只是画堆积的总值,
// setDrawHighlightArrow(true); // 没有该方法。。。是否绘制高亮箭头
// 下面只有PieChart(饼状图)有用
PieChart mPieChart = (PieChart) findViewById(R.id.pc);
List<PieEntry> pieEntries = new ArrayList<>();
pieEntries.add(new PieEntry(1, "11"));
pieEntries.add(new PieEntry(2, "22"));
pieEntries.add(new PieEntry(3, "33"));
PieDataSet iPieDataSet = new PieDataSet(pieEntries, "pie label");
iPieDataSet.setColors(colors);
iPieDataSet.setValueTextColors(colors);
iPieDataSet.setSliceSpace(3); // 每块之间的距离
PieData pieData = new PieData(iPieDataSet);
mPieChart.setData(pieData);
/*mPieChart.setDrawSliceText(true);*/ // : 将X值绘制到饼状图环切片内,否则不显示。默认true,已弃用,用下面setDrawEntryLabels()
mPieChart.setDrawEntryLabels(true); // 同上,默认true,记住颜色和环不要一样,否则会显示不出来
mPieChart.setUsePercentValues(true); // 表内数据用百分比替代,而不是原先的值。并且ValueFormatter中提供的值也是该百分比的。默认false
mPieChart.setCenterText("asc"); // 圆环中心的文字,会自动适配不会被覆盖
mPieChart.setCenterTextRadiusPercent(100f); // 中心文本边界框矩形半径比例,默认是100%.
mPieChart.setHoleRadius(60); // 设置中心圆半径占整个饼形图圆半径(图表半径)的百分比。默认50%
mPieChart.setTransparentCircleRadius(70); // 设置环形与中心圆之间的透明圆环半径占图表半径的百分比。默认55%(比如,中心圆为50%占比,而透明环设置为55%占比,要去掉中心圆的占比,也就是环只有5%的占比)
mPieChart.setTransparentCircleColor(Color.RED); // 上述透明圆环的颜色
mPieChart.setTransparentCircleAlpha(50); // 上述透明圆环的透明度[0-255],默认100
mPieChart.setMaxAngle(360); // 设置整个饼形图的角度,默认是360°即一个整圆,也可以设置为弧,这样现实的值也会重新计算
// 下面只有RadarChart(雷达图)有用
RadarChart mRadarChart = (RadarChart) findViewById(R.id.rc);
List<RadarEntry> radarEntries = new ArrayList<>();
radarEntries.add(new RadarEntry(1, "111"));
radarEntries.add(new RadarEntry(2, "222"));
radarEntries.add(new RadarEntry(3, "333"));
radarEntries.add(new RadarEntry(4, "444"));
radarEntries.add(new RadarEntry(5, "555"));
RadarDataSet iRadarDataSet = new RadarDataSet(radarEntries, "bar label");
iRadarDataSet.setColors(colors);
iRadarDataSet.setValueTextColors(colors);
RadarData radarData = new RadarData(iRadarDataSet);
mRadarChart.setData(radarData);
mRadarChart.setSkipWebLineCount(8); // 允许不绘制从中心发出的线,当线多时较有用。默认为0
// *************************其他********************************* //
// 上面介绍了MP的大部分常用的api,基本可以满足绝大部分的需求,还有部分不常用的暂时不说了,以后用的着再下面补充
// mLineChart.clear(); // 清空
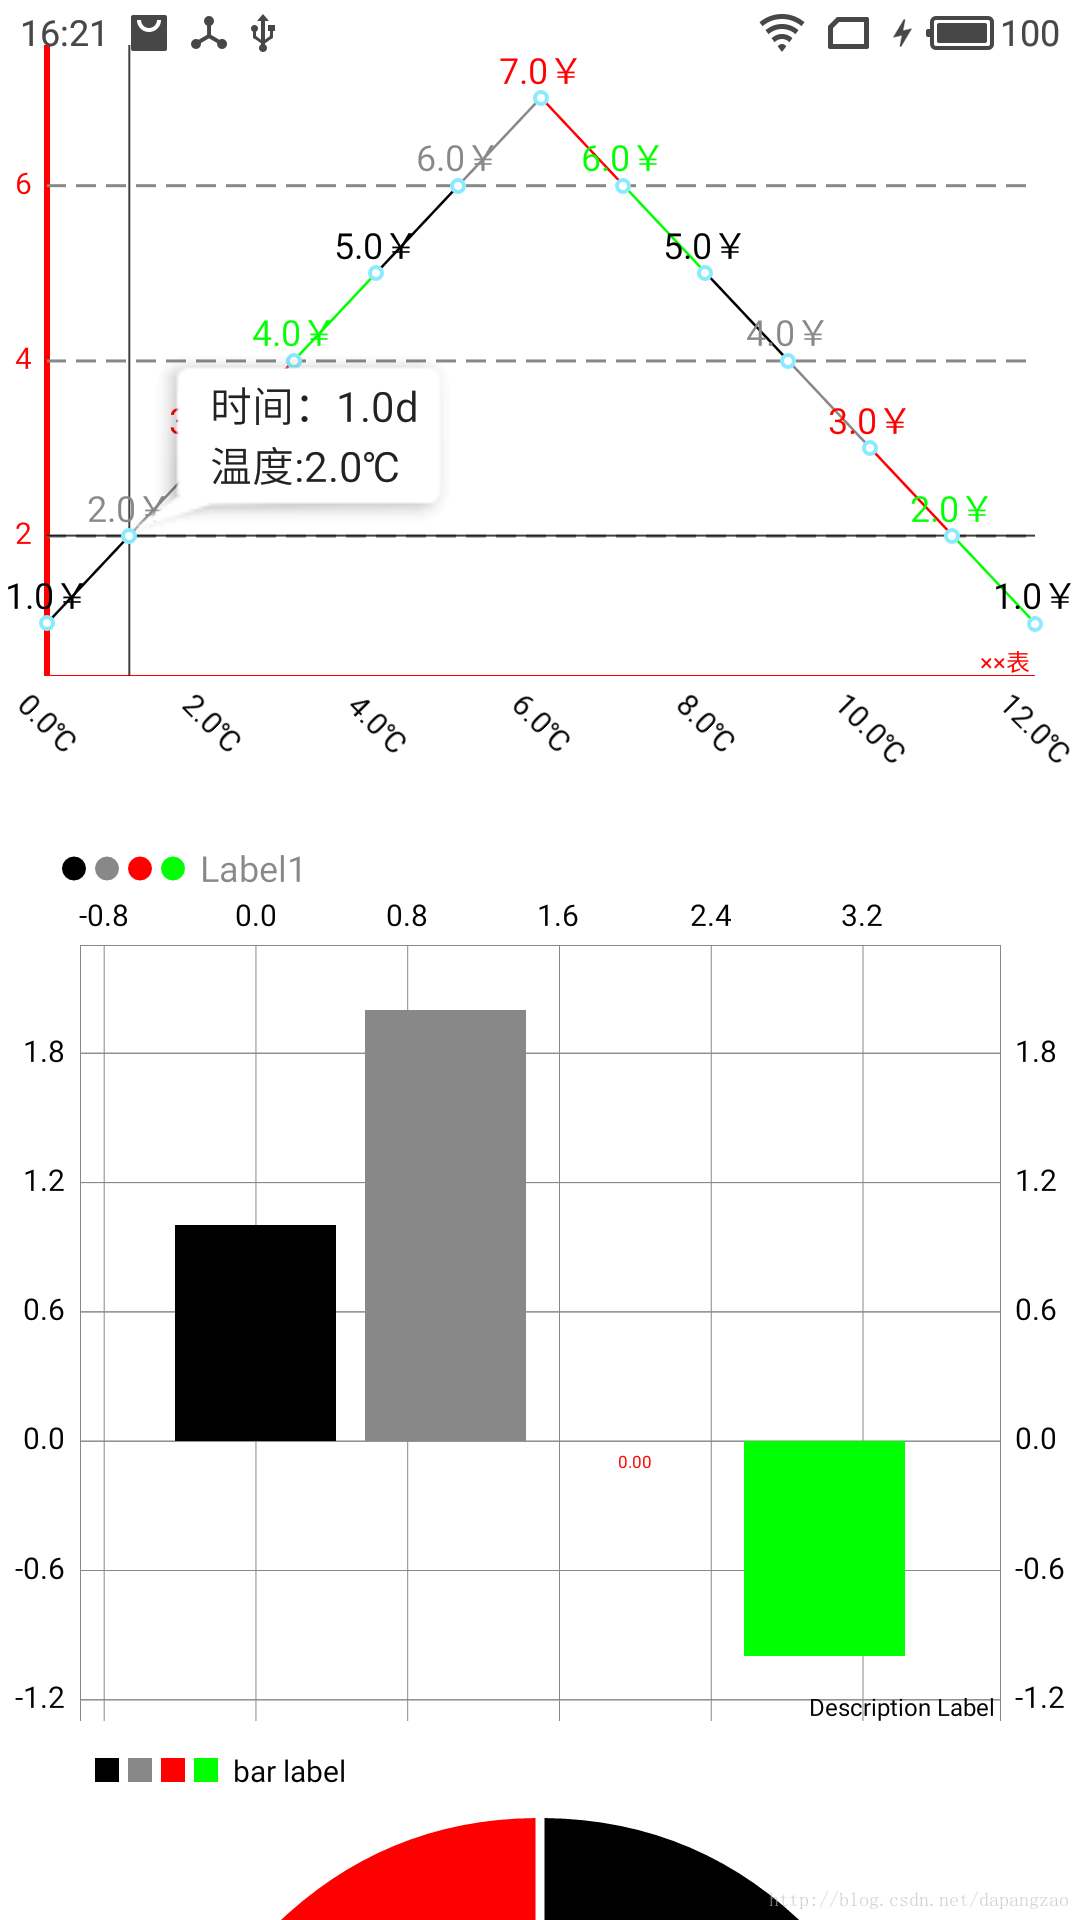
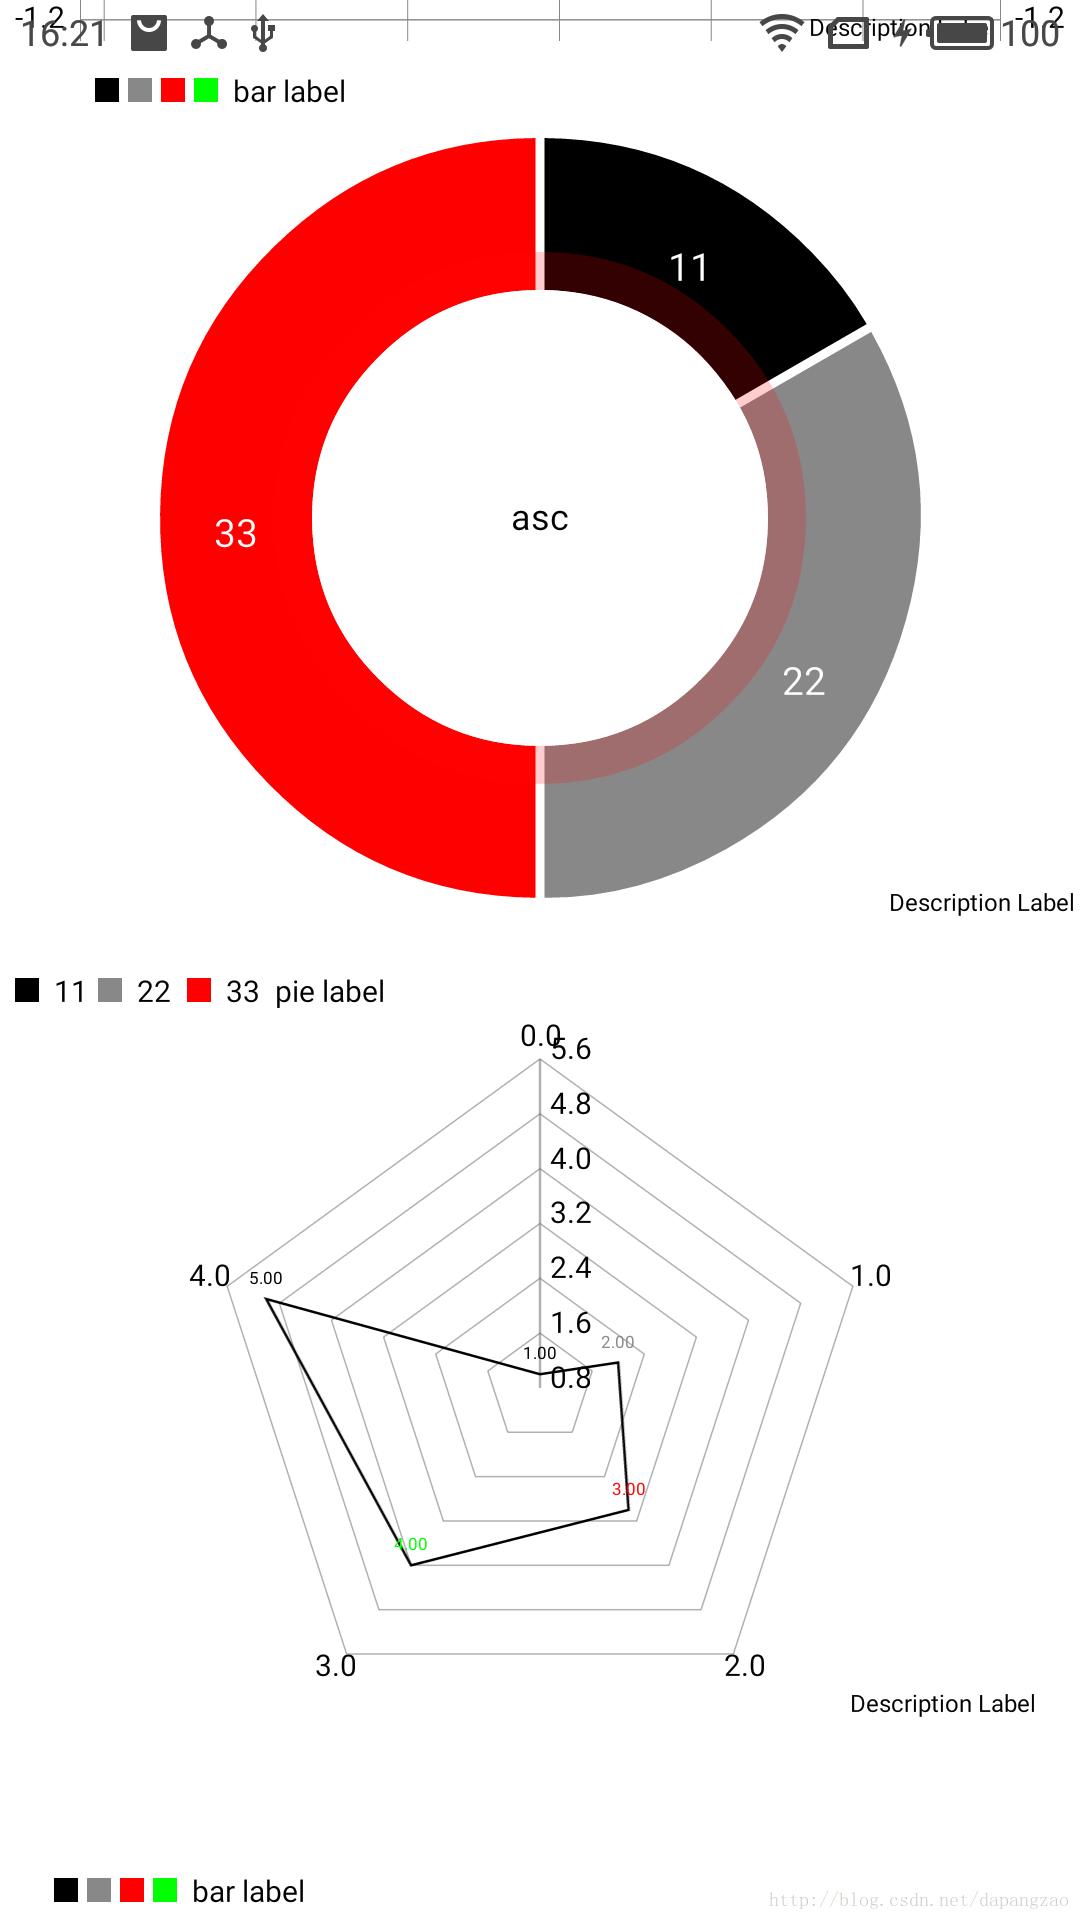
}废话也不多说了,上述所有接口都是测试过的,有些我标明没效果或者异常的,可能是我方法不对,使用时请自行测试。当然可能用不着那么多,使用时留下需要的即可。 来两张效果图:
四、常见异常及处理
这块是我后面补上去的,因为最近项目里出现了几个异常,让我很蛋疼。下面的几个问题的原因分析是我推测的,并没有直接看源码,八九不离十,如果有看了源码知道确切原因请指出,我会改正。
IndexOutOfBoundsException
首先是看图:
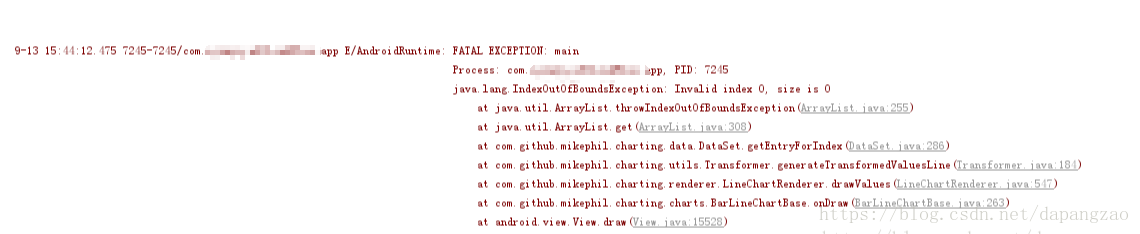
额,数组越界。那么哪里越界呢,从异常里是看不出的,其实就是LineDataSet对象数据为空,在绘制的时候,没有做判断就获取数据,结果没有数据时,直接gg。
解决:添加数据时判断是否为空,空了就不添加。
创建负数数组
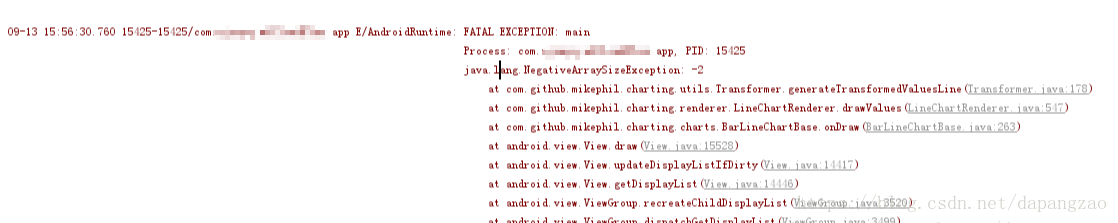
这个是创建了负数数组的问题,原因在于添加数据的顺序有误。就是每个LineDataSet的数据Entry的下标x要从小到大,不能倒序。
解决:要注意给LineDataSet添加数据时,每个Entry的x要从小到大来排,不能随意添加或者倒序。
其实这个问题大部分人可能遇不到,问题在哪呢。我项目中遇到的是这样的,后台返回了个倒序数据集合,而且数据有x值(int)。前人就没当回事(我也是接了坑了,当然我确实不知道MP有这个问题),直接往LineDataSet添加,结果第一个下标为15,最后一个为0,这样就死得难看了。但是我们一般不会直接用给定的值,因为一般不会是数字型的数据,有的还要转换,需要另外存储,下标肯定是从0开始依次增加的。
五、标签格式化与标记定制
1.IValueFormatter
数据点的值标签转换
public class MyValueFormatter implements IValueFormatter {

    public MyValueFormatter() {
        // 可以在这里执行一些用到的初始化操作,比如DecimalFormat初始化
    }

    @Override
    public String getFormattedValue(float value, Entry entry, int dataSetIndex, ViewPortHandler viewPortHandler) {
        // value是当前数据点的值,可以将其转换为带单位或其他内容。
        return value + "¥";
    }
}
2.IAxisValueFormatter
坐标轴的刻度标签转换
public class MyYAxisValueFormatter implements IAxisValueFormatter {

    public MyAxisValueFormatter() {
       // 初始化操作
    }

    @Override
    public String getFormattedValue(float value, AxisBase axis) {
        return value + "d";
    }
}
这个在X轴或Y轴都可以设置,应用中可以只传递数值,然后再用formatter来转添加单位。
3.IMarker
当点击选中数据时,提示的pop
public class YourMarkerView extends MarkerView {

    private TextView tvContent;

    public MyMarkerView(Context context, int layoutResource) {
        super(context, layoutResource);

        // find your layout components
        tvContent = (TextView) findViewById(R.id.tvContent);
    }

    // 每次MarKerView重绘时调用,可以用于更新内容
    @Override
    public void refreshContent(Entry e, Highlight highlight) {

        tvContent.setText("" + e.getY());

        // 执行必要的布局
        super.refreshContent(e, highlight);
    }

    private MPPointF mOffset;

    @Override
    public MPPointF getOffset() {

        if(mOffset == null) {
           // center the marker horizontally and vertically
           mOffset = new MPPointF(-(getWidth() / 2), -getHeight());
        }

        return mOffset;
    }
}
这个是继承自MarkerView,一种方便的实现方式,通常继承这个就够了,如果想高度定制,可以实现IMarker接口。 给出我上述自定义的ChartMarkerView:
package com.david.study.company;

import android.content.Context;
import android.widget.TextView;

import com.david.study.R;
import com.github.mikephil.charting.components.MarkerView;
import com.github.mikephil.charting.data.Entry;
import com.github.mikephil.charting.highlight.Highlight;
import com.github.mikephil.charting.utils.MPPointF;

/**
 * 测试markerView
 * Created by DavidChen on 2017/7/13.
 */

public class ChartMarkerView extends MarkerView {

    TextView tv_indicator;

    String item;
    String unit;

    /**
     * Constructor. Sets up the MarkerView with a custom layout resource.
     *
     * @param layoutResource the layout resource to use for the MarkerView
     */
    public ChartMarkerView(Context context, int layoutResource, String item, String unit) {
        super(context, layoutResource);
        tv_indicator = (TextView) findViewById(R.id.tv_indicator);
        this.item = null == item ? "" : item;
        this.unit = null == unit ? "" : unit;
    }

    private boolean isReverse = true;

    @Override
    public void refreshContent(Entry e, Highlight highlight) {
        isReverse = !(highlight.getX() > 8);
        String content = "时间:";
        content += e.getX() + "d";

        content += "\n" + item + e.getY() + unit;
        tv_indicator.setText(content);
        super.refreshContent(e, highlight);
    }

    @Override
    public MPPointF getOffset() {
        MPPointF mpPointF = super.getOffset();
        if (!isReverse ) {
            mpPointF.x = -tv_indicator.getWidth();
        } else {
            mpPointF.x = 0;
        }
        mpPointF.y = -tv_indicator.getHeight();
        return mpPointF;
    }
}
这里可能在显示边上的点时位置还欠考虑。仅供参考。
