转自: https://blog.csdn.net/qqyanjiang/article/details/51442120
目录 一步一步教你写股票走势图——分时图一(概述) 一步一步教你写股票走势图——分时图二(自定义xy轴) 一步一步教你写股票走势图——分时图三(对齐图表、自定义柱状图高亮) 一步一步教你写股票走势图——分时图四(高亮联动) 一步一步教你写股票走势图——分时图五(自定义标记) 一步一步教你写股票走势图——K线图一(概述) 一步一步教你写股票走势图——K线图二(图表联动) 一步一步教你写股票走势图——K线图三(添加均线) 一步一步教你写股票走势图——K线图四(高亮联动一) 一步一步教你写股票走势图——K线图五(高亮联动二) 一步一步教你写股票走势图——商业版
demo更新地址 https://github.com/AndroidJiang/StockChart
因为公司的项目需求,最近不得不研究下股票走势图,经过自己的学习和筛选,考虑到自己自定义图表库水平有限,最后选择[MpAndroidChart],项目源码将会在开发完毕后放到github上,欢迎star,(https://github.com/PhilJay/MPAndroidChart)图表库来实现股票走势图,本项目用的是v2.2.5。 股票走势图大致有两种:分时图,K线图。
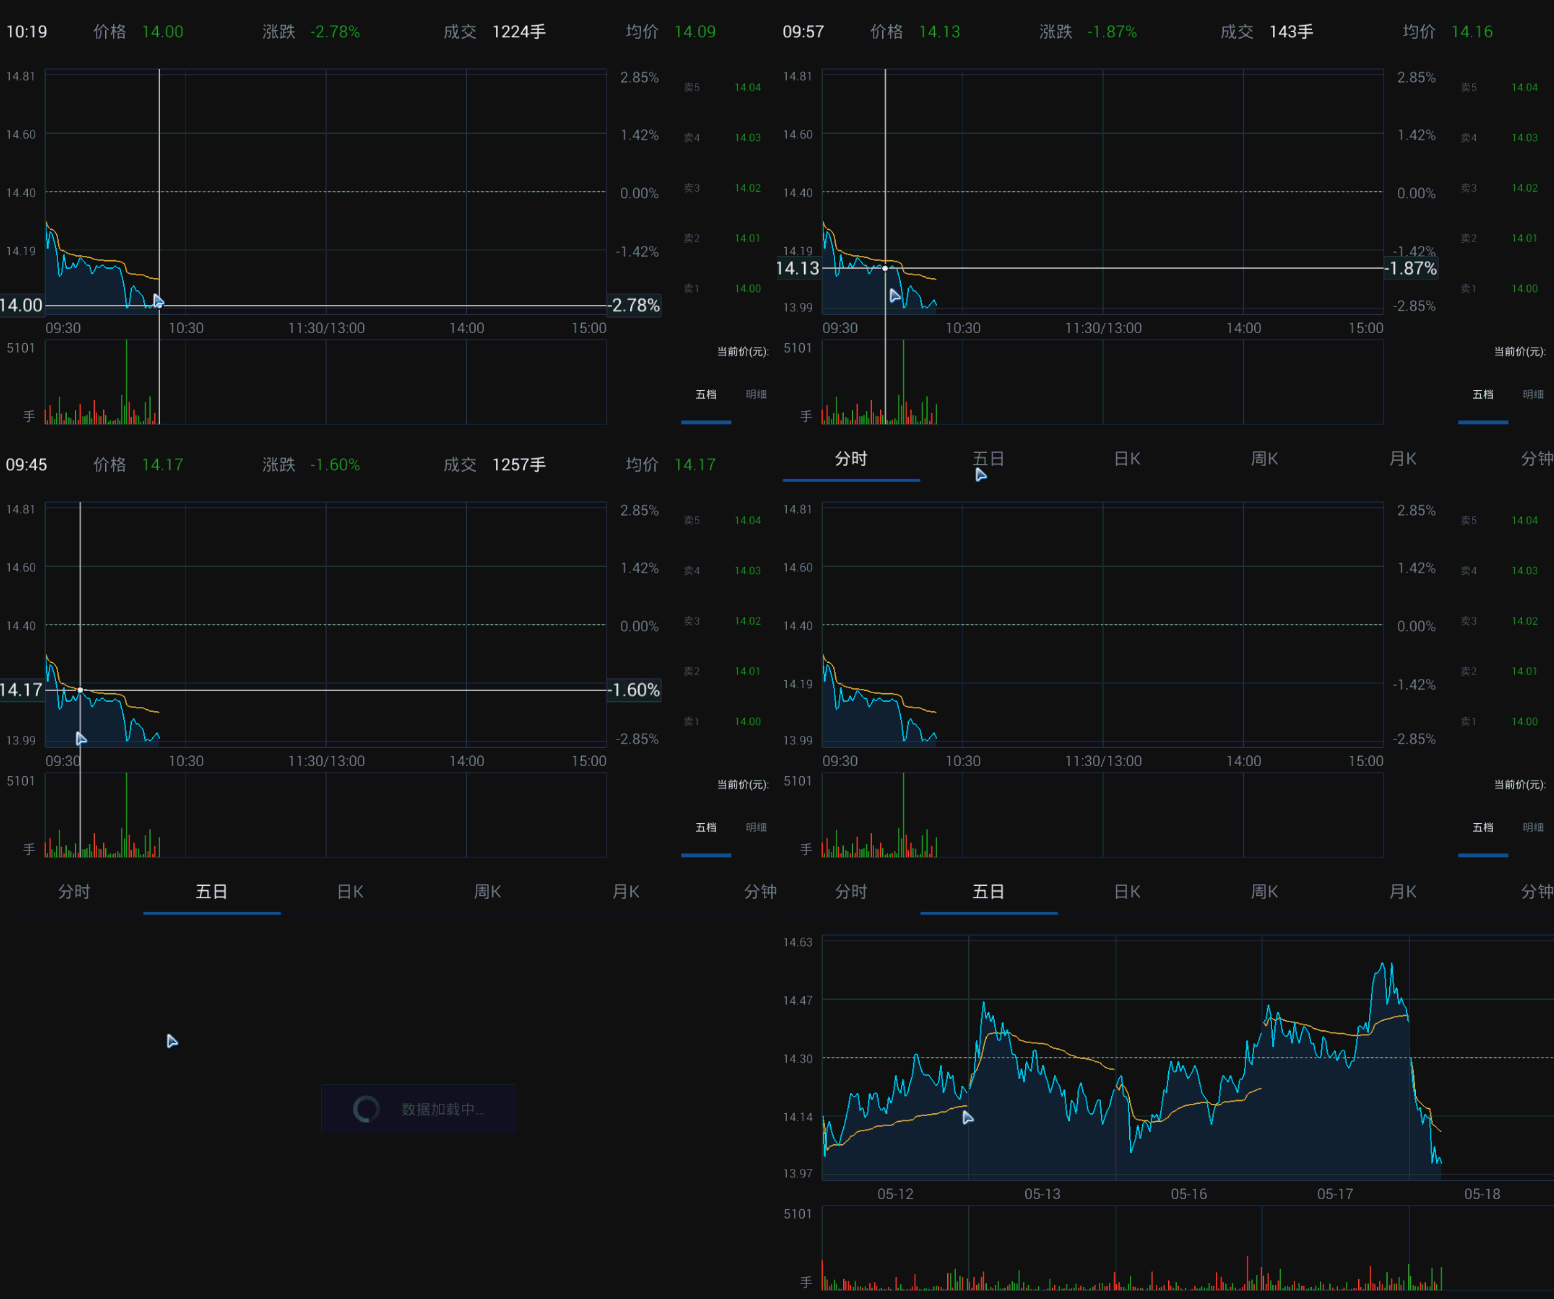
下面先贴上最终要实现的效果图:

这是最终效果,图片来自于自选股,最终实现的效果可能有点出入,不过大体差不多。
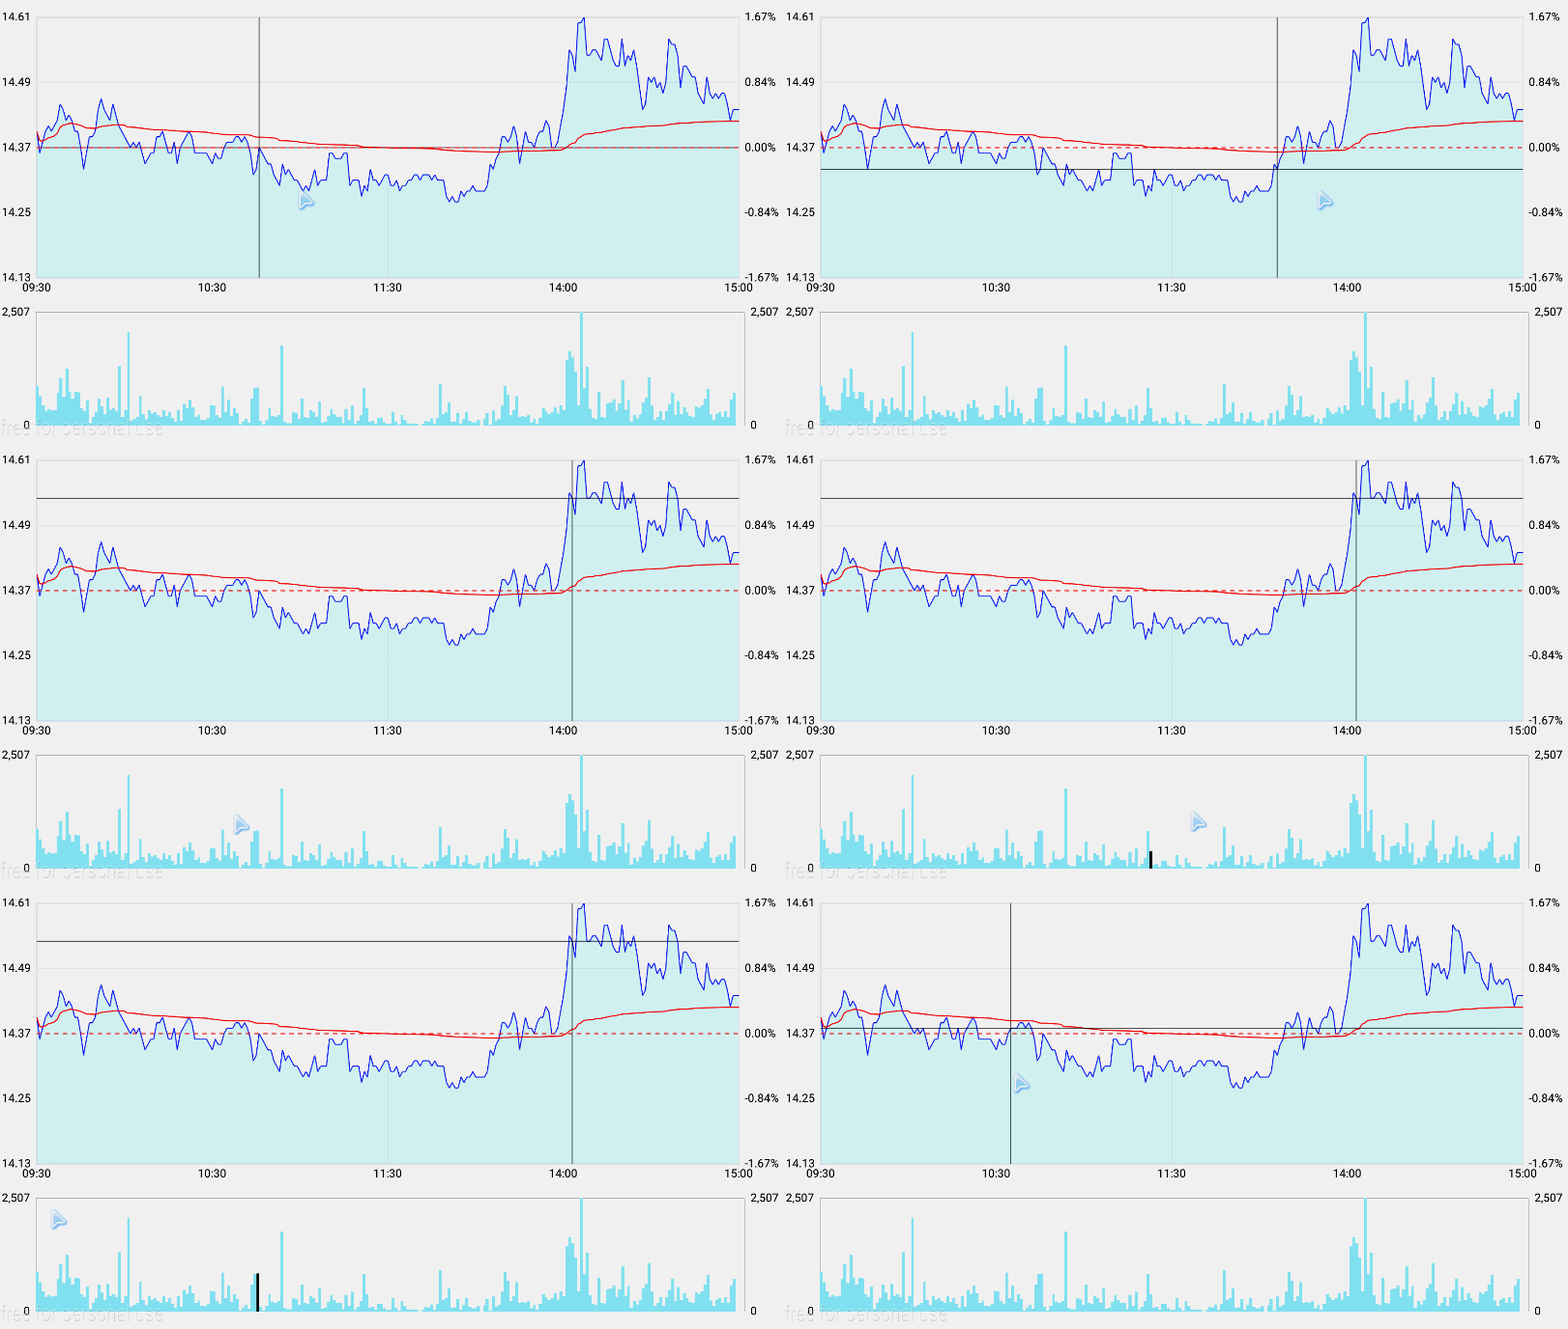
第一阶段先从简单的分时图开始,下面贴出第一阶段实现的效果图:

大致代码如下:
 private void initChart() {
        lineChart.setScaleEnabled(false);
        lineChart.setDrawBorders(true);
        lineChart.setBorderWidth(1);
        lineChart.setBorderColor(getResources().getColor(R.color.grayLine));
        lineChart.setDescription("");
        Legend lineChartLegend = lineChart.getLegend();
        lineChartLegend.setEnabled(false);

        barChart.setScaleEnabled(false);
        barChart.setDrawBorders(false);
      /*  barChart.setBorderWidth(1);
        barChart.setBorderColor(getResources().getColor(R.color.grayLine));*/
        barChart.setDescription("");
        Legend barChartLegend = barChart.getLegend();
        barChartLegend.setEnabled(false);
        //x轴
        xAxis = lineChart.getXAxis();
        xAxis.setPosition(XAxis.XAxisPosition.BOTTOM);
        xAxis.setLabelsToSkip(59);

        //左边y
        axisLeft = lineChart.getAxisLeft();
        axisLeft.setLabelCount(5, true);
        axisLeft.setDrawLabels(true);

        //bar x y轴
        xAxisBar = barChart.getXAxis();
        xAxisBar.setDrawLabels(false);
        xAxisBar.setDrawGridLines(false);

        axisLeftBar = barChart.getAxisLeft();
        axisLeftBar.setDrawGridLines(false);

        axisRightBar = barChart.getAxisRight();
       // axisRightBar.setDrawLabels(false);
        axisRightBar.setDrawGridLines(false);

        //y轴样式
        this.axisLeft.setValueFormatter(new YAxisValueFormatter() {
            @Override
            public String getFormattedValue(float value, YAxis yAxis) {
                DecimalFormat mFormat = new DecimalFormat("#0.00");
                return mFormat.format(value);
            }
        });
        //右边y
        this.axisRight = lineChart.getAxisRight();
        this.axisRight.setLabelCount(5, true);
        this.axisRight.setDrawLabels(true);
        this.axisRight.setValueFormatter(new YAxisValueFormatter() {
            @Override
            public String getFormattedValue(float value, YAxis yAxis) {
                DecimalFormat mFormat = new DecimalFormat("#0.00%");
                return mFormat.format(value);
            }
        });

        this.axisRight.setStartAtZero(false);
        this.axisRight.setDrawGridLines(false);
        this.axisRight.setDrawAxisLine(false);
        //背景线
        this.xAxis.setGridColor(getResources().getColor(R.color.grayLine));
        this.xAxis.setAxisLineColor(getResources().getColor(R.color.grayLine));
        this.axisLeft.setGridColor(getResources().getColor(R.color.grayLine));
        this.axisRight.setAxisLineColor(getResources().getColor(R.color.grayLine));

    }
获取数据:
 private void getMinutesData() {
        String code = "sz002081";
        subscriptionMinute = clientApi.getMinutes(code)
                .compose(SchedulersCompat.<ResponseBody>applyIoSchedulers())
                .subscribe(new Subscriber<ResponseBody>() {
                    @Override
                    public void onCompleted() {
                    }

                    @Override
                    public void onError(Throwable e) {
                        showToast("更新失败" + e.toString());
                    }

                    @Override
                    public void onNext(ResponseBody minutes) {
                        MData mData = new MData();
                        JSONObject object = null;
                        try {
                            object = new JSONObject(minutes.string());
                        } catch (JSONException e) {
                            e.printStackTrace();
                        } catch (IOException e) {
                            e.printStackTrace();
                        }
                        mData.parseData(object);
                        setData(mData);

                    }
                });
        mCompositeSubscription.add(subscriptionMinute);
    }
塞入数据:
 private void setData(MData mData) {
        if (mData.getDatas().size() == 0) {
            lineChart.setNoDataText("暂无数据");
            return;
        }
        //设置y左右两轴最大最小值
        axisLeft.setAxisMinValue(mData.getMin());
        axisLeft.setAxisMaxValue(mData.getMax());
        axisRight.setAxisMinValue(mData.getPercentMin());
        axisRight.setAxisMaxValue(mData.getPercentMax());

        axisLeftBar.setAxisMaxValue(mData.getVolmax());
        axisLeftBar.setAxisMinValue(0);//即使最小是不是0,也无碍
        axisLeftBar.setShowOnlyMinMax(true);
        axisRightBar.setAxisMaxValue(mData.getVolmax());
        axisRightBar.setAxisMinValue(0);//即使最小是不是0,也无碍
        axisRightBar.setShowOnlyMinMax(true);
        //基准线
        LimitLine ll = new LimitLine(mData.getBaseValue());
        ll.setLineWidth(1f);
        ll.setLineColor(Color.RED);
        ll.enableDashedLine(10f, 10f, 0f);
        ll.setLineWidth(1);
        axisLeft.addLimitLine(ll);

        ArrayList<Entry> lineCJEntries = new ArrayList<Entry>();
        ArrayList<Entry> lineJJEntries = new ArrayList<Entry>();
        ArrayList<String> dateList = new ArrayList<String>();
        ArrayList<BarEntry> barEntries = new ArrayList<BarEntry>();
        ArrayList<String> xVals = new ArrayList<String>();

        for (int i = 0; i < mData.getDatas().size(); i++) {
            //避免数据重复,skip也能正常显示
            if(mData.getDatas().get(i).time.equals("13:30")){
                continue;
            }
            lineCJEntries.add(new Entry(mData.getDatas().get(i).chengjiaojia, i));

            lineJJEntries.add(new Entry(mData.getDatas().get(i).junjia, i));
            barEntries.add(new BarEntry(mData.getDatas().get(i).chengjiaoliang, i));
            dateList.add(mData.getDatas().get(i).time);
        }
        d1 = new LineDataSet(lineCJEntries, "成交价");
        d2 = new LineDataSet(lineJJEntries, "均价");
        barDataSet = new BarDataSet(barEntries, "成交量");

        d1.setCircleRadius(0);
        d2.setCircleRadius(0);
        d1.setColor(Color.BLUE);
        d2.setColor(Color.RED);
        d1.setHighLightColor(Color.BLACK);
        d2.setHighlightEnabled(false);
        d1.setDrawFilled(true);

        barDataSet.setBarSpacePercent(0); //bar空隙
        barDataSet.setHighLightColor(Color.BLACK);
        barDataSet.setHighLightAlpha(255);
        barDataSet.setDrawValues(false);
        //谁为基准
        d1.setAxisDependency(YAxis.AxisDependency.LEFT);
       // d2.setAxisDependency(YAxis.AxisDependency.RIGHT);
        ArrayList<ILineDataSet> sets = new ArrayList<ILineDataSet>();
        sets.add(d1);
        sets.add(d2);
        LineData cd = new LineData(dateList, sets);
        lineChart.setData(cd);

        BarData barData=new BarData(dateList,barDataSet);
        barChart.setData(barData);
        lineChart.invalidate();//刷新图
        barChart.invalidate();
    }
总结一下有几个问题:
- 当x轴没有到当天的15:00时,仍然充满整个x轴,需求是x轴数据时不变的,更新到几点,表就画到几点
- 下面柱状图高亮效果不是十字架,差评
- 两个表之间没有联动
- 高亮地方应该展示对应轴的数据
目前来说,有以上四个问题需要解决,本篇到此为止。
目录 一步一步教你写股票走势图——分时图一(概述) 一步一步教你写股票走势图——分时图二(自定义xy轴) 一步一步教你写股票走势图——分时图三(对齐图表、自定义柱状图高亮) 一步一步教你写股票走势图——分时图四(高亮联动) 一步一步教你写股票走势图——分时图五(自定义标记) 一步一步教你写股票走势图——K线图一(概述) 一步一步教你写股票走势图——K线图二(图表联动) 一步一步教你写股票走势图——K线图三(添加均线) 一步一步教你写股票走势图——K线图四(高亮联动一) 一步一步教你写股票走势图——K线图五(高亮联动二) 一步一步教你写股票走势图——商业版
demo更新地址https://github.com/AndroidJiang/StockChart