转自: https://blog.csdn.net/u014769864/article/details/71479591
公司做金融的,之前项目用的MPAndroidChart来完成分时图和K线图图表,不过之前的项目用的MPAndroidChart版本很老很老了,我也只好自己去尝试最新版本的MPAndroidChart了,虽然我也是刚接触MPAndroidChart不久,如果MPAndroidChart 之LineChart不懂基本属性的设置也可以看看MPAndroidChart3.0之LineChart。 https://blog.csdn.net/u014769864/article/details/70888717
MPAndroidChart系列:
MPAndroidChart之LineChart(1)
MPAndroidChart之LineChart(2)MarkerView
MPAndroidChart之LinChart(3)scale缩放
本文MPAndroidChart使用版本:(3的版本了)
compile 'com.github.PhilJay:MPAndroidChart:v3.0.2'我没有使用gradle依赖,而是把代码拉下来依赖的,因为:
- 在使用过程中发现了好多旧版本有的api,新版本的不知道丢哪里去了;
- 另外挺多使用的问题,比如缩放,重新设置数据后错乱问题....
但是还是值得使用的,因为大部分的基本图表它都能满足,也灵活,https://github.com/PhilJay/MPAndroidChart 上的星星说明了一切安静。
现在先看下下面使用MPAndroidChart 之LineChart实现的效果:
上面gif是实现的效果,下面截图是我认为使用LineChart画折线图要知道的步骤,我用1、2...数字标出来了。
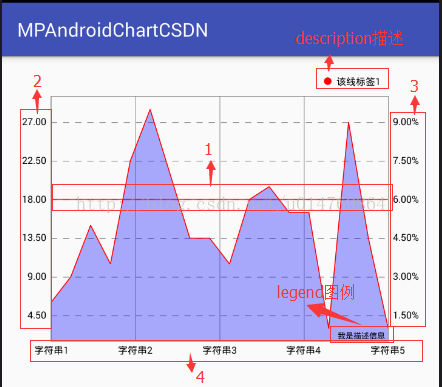
gif图里的左右和下边的markerview暂时不提,先把要画的折线图基本东西能随便使用在说。
我们都知道在画图的时候肯定是把(x,y)坐标传进去,然后根据坐标数据进行计算然后在画出图来,MPAndroidChart怎么计算怎么画的,不是特例或研究源码我们就不会太关心,但是有几个在使用时我们是比较关心的,也就是我标注出来的1到4的4个数字。
1、这根线的属性设置(相当于一根拦截线或水位线一样,专业名称叫“基线”);
2、左边Y轴的数据(我们想要设置什么数据就什么数据);
3、右边Y轴的数据(我们想要设置什么数据就什么数据);
4、底部X轴的数据(我们想设置多少个数据也就是label数或什么数据就设置什么数据)。
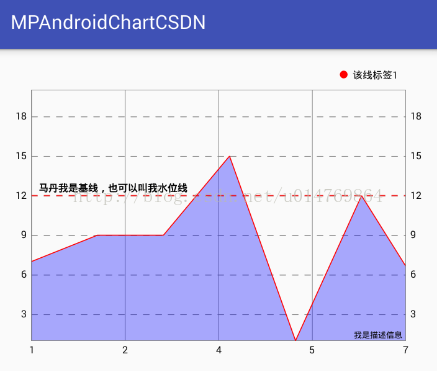
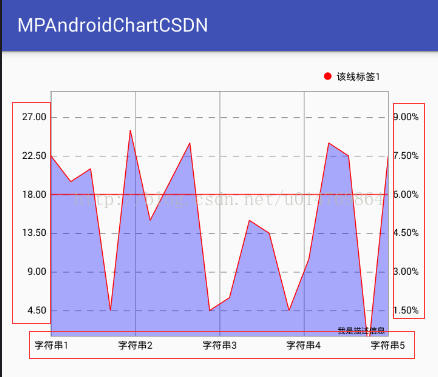
1、基线和基本设置
下面我贴出LineChart基本属性设置的代码,包括了1提到的,但2、3、4要说的不在里面,下面只是设置LineChart基本属性和设置坐标数据:
效果图:
代码
    package com.mpandroidchartcsdn;

    import android.graphics.Color;
    import android.os.Bundle;
    import android.support.v7.app.AppCompatActivity;

    import com.github.mikephil.charting.components.Description;
    import com.github.mikephil.charting.components.Legend;
    import com.github.mikephil.charting.components.LimitLine;
    import com.github.mikephil.charting.components.XAxis;
    import com.github.mikephil.charting.components.YAxis;
    import com.github.mikephil.charting.data.Entry;
    import com.github.mikephil.charting.data.LineData;
    import com.github.mikephil.charting.data.LineDataSet;
    import com.github.mikephil.charting.interfaces.datasets.ILineDataSet;
    import com.mpandroidchartcsdn.mychart.MyLineChart;

    import java.util.ArrayList;
    import java.util.List;

    public class MainActivity extends AppCompatActivity {
        private MyLineChart mLineChart;
        private ArrayList<Entry> pointValues;

        @Override
        protected void onCreate(Bundle savedInstanceState) {
            super.onCreate(savedInstanceState);
            setContentView(R.layout.activity_main);

            mLineChart = (MyLineChart) findViewById(R.id.lineChart);
            initChart();
            initData();
        }

        //设置chart基本属性
        private void initChart() {
            //描述信息
            Description description = new Description();
            description.setText("我是描述信息");
            //设置描述信息
            mLineChart.setDescription(description);
            //设置没有数据时显示的文本
            mLineChart.setNoDataText("没有数据喔~~");
            //设置是否绘制chart边框的线
            mLineChart.setDrawBorders(true);
            //设置chart边框线颜色
            mLineChart.setBorderColor(Color.GRAY);
            //设置chart边框线宽度
            mLineChart.setBorderWidth(1f);
            //设置chart是否可以触摸
            mLineChart.setTouchEnabled(true);
            //设置是否可以拖拽
            mLineChart.setDragEnabled(true);
            //设置是否可以缩放 x和y,默认true
            mLineChart.setScaleEnabled(false);
            //设置是否可以通过双击屏幕放大图表。默认是true
            mLineChart.setDoubleTapToZoomEnabled(false);
            //设置chart动画
            mLineChart.animateXY(1000, 1000);

            //=========================设置图例=========================
            // 像"□ xxx"就是图例
            Legend legend = mLineChart.getLegend();
            //设置图例显示在chart那个位置 setPosition建议放弃使用了
            //设置垂直方向上还是下或中
            legend.setVerticalAlignment(Legend.LegendVerticalAlignment.TOP);
            //设置水平方向是左边还是右边或中
            legend.setHorizontalAlignment(Legend.LegendHorizontalAlignment.RIGHT);
            //设置所有图例位置排序方向
            legend.setOrientation(Legend.LegendOrientation.HORIZONTAL);
            //设置图例的形状 有圆形、正方形、线
            legend.setForm(Legend.LegendForm.CIRCLE);
            //是否支持自动换行 目前只支持BelowChartLeft, BelowChartRight, BelowChartCenter
            legend.setWordWrapEnabled(true);

            //=======================设置X轴显示效果==================
            XAxis xAxis = mLineChart.getXAxis();
            //是否启用X轴
            xAxis.setEnabled(true);
            //是否绘制X轴线
            xAxis.setDrawAxisLine(true);
            //设置X轴上每个竖线是否显示
            xAxis.setDrawGridLines(true);
            //设置是否绘制X轴上的对应值(标签)
            xAxis.setDrawLabels(true);
            //设置X轴显示位置
            xAxis.setPosition(XAxis.XAxisPosition.BOTTOM);
            //设置竖线为虚线样式
            // xAxis.enableGridDashedLine(10f, 10f, 0f);
            //设置x轴标签数
            xAxis.setLabelCount(5, true);
            //图表第一个和最后一个label数据不超出左边和右边的Y轴
            // xAxis.setAvoidFirstLastClipping(true);

           //设置限制线 12代表某个该轴某个值,也就是要画到该轴某个值上
            LimitLine limitLine = new LimitLine(12);
            //设置限制线的宽
            limitLine.setLineWidth(1f);
            //设置限制线的颜色
            limitLine.setLineColor(Color.RED);
            //设置基线的位置
            limitLine.setLabelPosition(LimitLine.LimitLabelPosition.LEFT_TOP);
            limitLine.setLabel("马丹我是基线,也可以叫我水位线");
            //设置限制线为虚线
            limitLine.enableDashedLine(10f, 10f, 0f);
            //左边Y轴添加限制线
            axisLeft.addLimitLine(limitLine);

            //=================设置左边Y轴===============
            YAxis axisLeft = mLineChart.getAxisLeft();
            //是否启用左边Y轴
            axisLeft.setEnabled(true);
            //设置最小值(这里就按demo里固死的写)
            axisLeft.setAxisMinimum(1);
            //设置最大值(这里就按demo里固死的写了)
            axisLeft.setAxisMaximum(20);
            //设置横向的线为虚线
            axisLeft.enableGridDashedLine(10f, 10f, 0f);
            //axisLeft.setDrawLimitLinesBehindData(true);

            //====================设置右边的Y轴===============
            YAxis axisRight = mLineChart.getAxisRight();
            //是否启用右边Y轴
            axisRight.setEnabled(true);
            //设置最小值(这里按demo里的数据固死写了)
            axisRight.setAxisMinimum(1);
            //设置最大值(这里按demo里的数据固死写了)
            axisRight.setAxisMaximum(20);
            //设置横向的线为虚线
            axisRight.enableGridDashedLine(10f, 10f, 0f);

        }

        //设置数据
        private void initData() {
            //每个点的坐标,自己随便搞点(x,y)坐标就可以了
            pointValues = new ArrayList<>();
            for (int i = 1; i < 19; i++) {
                int y = (int)( Math.random() * 20);
                pointValues.add(new Entry(i, y));

            }

            //点构成的某条线
            LineDataSet lineDataSet = new LineDataSet(pointValues, "该线标签1");
            //设置该线的颜色
            lineDataSet.setColor(Color.RED);
            //设置每个点的颜色
            lineDataSet.setCircleColor(Color.YELLOW);
            //设置该线的宽度
            lineDataSet.setLineWidth(1f);
            //设置每个坐标点的圆大小
            //lineDataSet.setCircleRadius(1f);
            //设置是否画圆
            lineDataSet.setDrawCircles(false);
            // 设置平滑曲线模式
            //  lineDataSet.setMode(LineDataSet.Mode.CUBIC_BEZIER);
            //设置线一面部分是否填充颜色
            lineDataSet.setDrawFilled(true);
            //设置填充的颜色
            lineDataSet.setFillColor(Color.BLUE);
            //设置是否显示点的坐标值
            lineDataSet.setDrawValues(false);

            //线的集合(可单条或多条线)
            List<ILineDataSet> dataSets = new ArrayList<>();
            dataSets.add(lineDataSet);
            //把要画的所有线(线的集合)添加到LineData里
            LineData lineData = new LineData(dataSets);
            //把最终的数据setData
            mLineChart.setData(lineData);

        }
    }
2、X轴label设置
先不管怎么样,LineChart图表的基本设置上面那些属性够用了,但是,要用到项目上,呵呵~~,对比一下上面的截图和之前我标注了1、2、3、4的截图,我们要提个问题,像标志的第二张图里的左右Y轴和X轴,我想设置自己想要的数据怎么办呢?在MPAndroidChart有两种方法。
第一种设置X轴Label方法:
在3.0.2里是通过setValueFormatter()方法设置的。setValueFormatter()方法里getFormattedValue里的参数value我们必须知道它是我们坐标点的X轴的数字通过MPAndroidChart内部计算后要画上去的坐标值。对于每个不同轴的value,如果还不清楚是什么的,建议多换换坐标值打印打印然后和线的坐标对比对比,肯定会知道并且找到规律的。
现在我要在上面的基础上设置字符串作为X轴的数据也就是label
代码
Map<Integer, String> xMap = new HashMap<>();
final String[] valueArry = {"字符串1", "字符串2", "字符串3", "字符串4", "字符串5"};
//下边if判断是为了使setLabelCount起作用:坐标数量/x轴标签数量 = 每个标签坐标数量,如果最后两个标签坐标数量相差大于对于5
// setLabelCount就显示不正常,也就是每个label要大概平均分配setLabelCount才能正常显示设置的标签数量
for (int i = 0; i < pointValues.size(); i++) {
if (i < 4) {
xMap.put((int) pointValues.get(i).getX(), valueArry[0]);
} else if (i < 8) {
xMap.put((int) pointValues.get(i).getX(), valueArry[1]);
} else if (i < 12) {
xMap.put((int) pointValues.get(i).getX(), valueArry[2]);
} else if (i < 16) {
xMap.put((int) pointValues.get(i).getX(), valueArry[3]);
} else if (i < 18) {
xMap.put((int) pointValues.get(i).getX(), valueArry[4]);
}
}
//自定义x轴标签数据
xAxis.setValueFormatter(new IAxisValueFormatter() {
@Override
public String getFormattedValue(float value, AxisBase axis) {
return xMap.get((int)value);
}
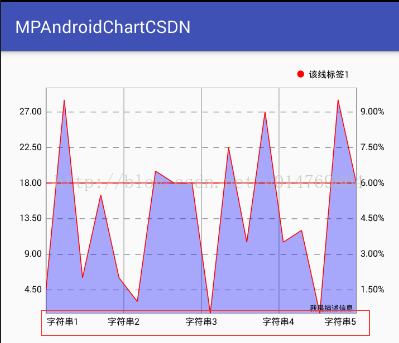
});对于使用setLabelCount控制x轴的label数还是要说一下,之前调用setLabelCount方法不起作用,后面测试好多次才发现要使setLabelCount起作用: “坐标数量/x轴标签数量 = 每个标签坐标数量,如果最后两个标签坐标数量相差大于等于5,setLabelCount就显示不正常,也就是每个label要大概平均分配setLabelCount才能正常显示设置的标签数量,否则不起作用” 对于这个是否这样,我建议大家去试试,这个真心蛋疼。
加了上面代码后效果图
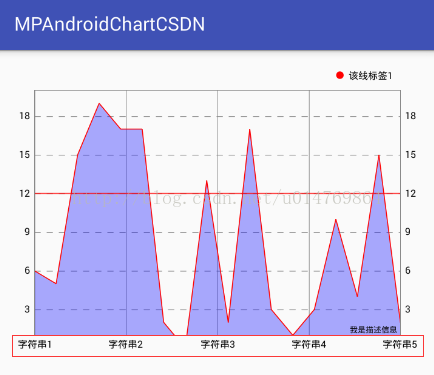
第二种设置X轴Label方法:
MPAndroidChart有个类XAxisRenderer,这个类主要是绘制X轴的一些属性或者X轴其他的东西(具体可以看官方doc)。 https://javadoc.jitpack.io/com/github/PhilJay/MPAndroidChart/v3.0.2/javadoc/
1、写个类MyXAxisRenderer继承XAxisRenderer
代码:
    package com.mpandroidchartcsdn.mychart;

    import android.graphics.Canvas;

    import com.github.mikephil.charting.components.XAxis;
    import com.github.mikephil.charting.renderer.XAxisRenderer;
    import com.github.mikephil.charting.utils.MPPointF;
    import com.github.mikephil.charting.utils.Transformer;
    import com.github.mikephil.charting.utils.Utils;
    import com.github.mikephil.charting.utils.ViewPortHandler;

    public class MyXAxisRenderer extends XAxisRenderer {
        //这里为了方便把X轴标签放到这里了,其实可以通过其他方式能拿到要设置的X轴标签就可以
        private String[] xLable = {"字符串1", "字符串2", "字符串3", "字符串4", "字符串5"};

        public MyXAxisRenderer(ViewPortHandler viewPortHandler, XAxis xAxis, Transformer trans) {
            super(viewPortHandler, xAxis, trans);
        }

        //重写drawLabels
        @Override
        protected void drawLabels(Canvas c, float pos, MPPointF anchor) {
            //把源码代码复制过来
            final float labelRotationAngleDegrees = mXAxis.getLabelRotationAngle();
            boolean centeringEnabled = mXAxis.isCenterAxisLabelsEnabled();

            float[] positions = new float[mXAxis.mEntryCount * 2];

            for (int i = 0; i < positions.length; i += 2) {

                // only fill x values
                if (centeringEnabled) {
                    positions[i] = mXAxis.mCenteredEntries[i / 2];
                } else {
                    positions[i] = mXAxis.mEntries[i / 2];
                }
            }

            mTrans.pointValuesToPixel(positions);

            for (int i = 0; i < positions.length; i += 2) {

                float x = positions[i];

                if (mViewPortHandler.isInBoundsX(x)) {

                    //修改源码 这里添加要设置的X轴的label
                    String label = xLable[i / 2];
                    // String label = mXAxis.getValueFormatter().getFormattedValue(mXAxis.mEntries[i / 2], mXAxis);

                    if (mXAxis.isAvoidFirstLastClippingEnabled()) {
                        // avoid clipping of the last  mXAxis.mEntryCount - 1为x轴坐标的标签数
                        if (i == mXAxis.mEntryCount - 1 && mXAxis.mEntryCount > 1) {
                            float width = Utils.calcTextWidth(mAxisLabelPaint, label);

                            if (width > mViewPortHandler.offsetRight() * 2
                                    && x + width > mViewPortHandler.getChartWidth())
                                x -= width / 2;
                            // avoid clipping of the first
                        } else if (i == 0) {

                            float width = Utils.calcTextWidth(mAxisLabelPaint, label);
                            x += width / 2;
                        }
                    }
                    drawLabel(c, label, x, pos, anchor, labelRotationAngleDegrees);
                }
            }

        }
    }
2、在写个MyLineChart继承LineChart
代码:
    package com.mpandroidchartcsdn.mychart;

            import android.content.Context;
            import android.util.AttributeSet;

            import com.github.mikephil.charting.charts.LineChart;

    /**
     * Created by tujingwu on 2017/5/4
     * .
     */

    public class MyLineChart extends LineChart {

        public MyLineChart(Context context) {
            super(context);
        }

        public MyLineChart(Context context, AttributeSet attrs) {
            super(context, attrs);
        }

        @Override
        protected void init() {
            super.init();
            mXAxisRenderer = new MyXAxisRenderer(mViewPortHandler, mXAxis, mLeftAxisTransformer);
        }

    }
3、像使用LineChart一样使用MyLineChart就可以了
既然我们x轴数据都知道怎么定义了,Y轴的数据也同理,这里就以第一种方式(当然你也可以以第二种方式实现),通过setValueFormatter()方法来设置你要定义的Y轴的数据,比如我想要左边Y轴数据按现在的数据1.5倍显示,Y轴右边按0.5倍,然后以百分数显示。
代码
    final DecimalFormat decimalFormat = new DecimalFormat("#0.00");
            axisLeft.setValueFormatter(new IAxisValueFormatter() {
                @Override
                public String getFormattedValue(float value, AxisBase axis) {
                    return decimalFormat.format(value * 1.5);
                }
            });
final DecimalFormat decimalFormat2 = new DecimalFormat("#0.00%");
axisRight.setValueFormatter(new IAxisValueFormatter() {
@Override
public String getFormattedValue(float value, AxisBase axis) {
return decimalFormat2.format((value * 0.5) / 100);
}
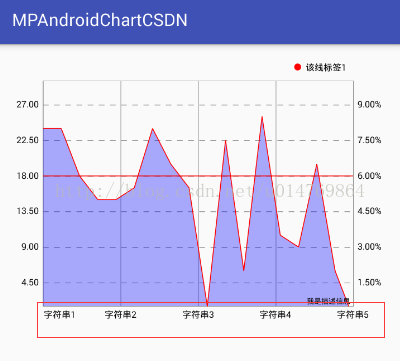
});效果图
ok,现在想怎么设就怎么设轴的数据了,之前我提的1、2、3、4都实现了,但是当中还有一个问题,就是上图中的x轴数据,“字符串1”和“字符串5” 是不是超出了Y轴的左右两边的轴线?,我们现在想要变成下图这样子
先找找看看有没有api,恩,找到一个方法setAvoidFirstLastClipping(),从名字上就可以看出大概意思,官方api介绍是“if set to true, the chart will avoid that the first and last label entry in the chart "clip" off the edge of the chart or the screen”;官方文档地址 https://javadoc.jitpack.io/com/github/PhilJay/MPAndroidChart/v3.0.2/javadoc/ 我英语差,但大概意思是“图表第一个和最后一个label数据不超出左边和右边的Y轴”,我们使用该方法设置为true;
效果图
呃呃呃,又喜又惊,什么鬼,说好的第一个和最后一个的呢,我们顺着setAvoidFirstLastClipping()方法找到源码对应的位置,也就是源码XAxisRenderer类中drawLabels方法
可能有些人头疼,看5分钟看不懂,看20分钟也看不懂,看30分钟也看不懂,但是为了解决上面的问题还是要硬着头皮看下去
drawLabels源码
    /**
         * draws the x-labels on the specified y-position
         *
         * @param pos
         */
        protected void drawLabels(Canvas c, float pos, MPPointF anchor) {

            final float labelRotationAngleDegrees = mXAxis.getLabelRotationAngle();
            boolean centeringEnabled = mXAxis.isCenterAxisLabelsEnabled();

            float[] positions = new float[mXAxis.mEntryCount * 2];

            for (int i = 0; i < positions.length; i += 2) {

                // only fill x values
                if (centeringEnabled) {
                    positions[i] = mXAxis.mCenteredEntries[i / 2];
                } else {
                    positions[i] = mXAxis.mEntries[i / 2];
                }
            }

            mTrans.pointValuesToPixel(positions);

            for (int i = 0; i < positions.length; i += 2) {

                float x = positions[i];

                if (mViewPortHandler.isInBoundsX(x)) {

                    String label = mXAxis.getValueFormatter().getFormattedValue(mXAxis.mEntries[i / 2], mXAxis);

                    if (mXAxis.isAvoidFirstLastClippingEnabled()) {
                        // avoid clipping of the last
                        if (i == mXAxis.mEntryCount - 1 && mXAxis.mEntryCount > 1) {
                            float width = Utils.calcTextWidth(mAxisLabelPaint, label);

                            if (width > mViewPortHandler.offsetRight() * 2
                                    && x + width > mViewPortHandler.getChartWidth())
                                x -= width / 2;
                            // avoid clipping of the first
                        } else if (i == 0) {

                            float width = Utils.calcTextWidth(mAxisLabelPaint, label);
                            x += width / 2;
                        }
                    }
                    drawLabel(c, label, x, pos, anchor, labelRotationAngleDegrees);
                }
            }

        }
OK,我们在使用方法setAvoidFirstLastClipping后,只有第一个“字符串1”缩进去了,最后一个“字符串5”没有缩进去,上面的源码我们注意这段代码
    if (mXAxis.isAvoidFirstLastClippingEnabled()) {
                        // avoid clipping of the last  mXAxis.mEntryCount - 1为x轴坐标的标签数
                        if (i == mXAxis.mEntryCount - 1 && mXAxis.mEntryCount > 1) {
                            float width = Utils.calcTextWidth(mAxisLabelPaint, label);

                            if (width > mViewPortHandler.offsetRight() * 2
                                    && x + width > mViewPortHandler.getChartWidth())
                                x -= width / 2;
                            // avoid clipping of the first
                        } else if (i == 0) {

                            float width = Utils.calcTextWidth(mAxisLabelPaint, label);
                            x += width / 2;
                        }
                    }
恩,没错,就是它了,一看第一个判断不就是指最后一个标签,第二个判断指第一个标签吗,可是为什么“字符串1”缩进去了,“字符串5”没有缩进去呢?打印一下就清清楚楚了,原来i它为“x轴标签数乘以2” 也就是为什么第一个“字符串1”缩进去了,“字符串5”没有缩进去呢,因为第一个判断不是X轴最后一个标签,X轴最后一个标签应该为“i==(mXAxis.mEntryCount-1)*2” ,"i== 0"当然是X轴第一个标签拉,所以为什么我们设置了setAvoidFirstLastClipping后只有第一个起作用,既然这样,我们把上面的判断修改成下面那样
    if (mXAxis.isAvoidFirstLastClippingEnabled()) {

                        // avoid clipping of the last mXAxis.mEntryCount-1为x轴标签数
                        if (i == mXAxis.mEntryCount - 1 && mXAxis.mEntryCount > 1) {
                            float width = Utils.calcTextWidth(mAxisLabelPaint, label);

                            if (width > mViewPortHandler.offsetRight() * 2
                                    && x + width > mViewPortHandler.getChartWidth())
                                x -= width / 2;
                            // avoid clipping of the first
                        } else if (i == 0) {

                            float width = Utils.calcTextWidth(mAxisLabelPaint, label);
                            x += width / 2;
                            //重写该方法 添加的代码,x轴最后一个标签缩进
                        } else if (i == (mXAxis.mEntryCount - 1) * 2) {
                            float width = Utils.calcTextWidth(mAxisLabelPaint, label);
                            x -= width / 2;
                        }
                    }
可是有个问题,如果不算是bug(这个应该不算吧,哈哈),我们最好不要乱修改源码是不啦,那重写该方法,把代码拷过去就好了
继承重写的代码
    package com.mpandroidchartcsdn.mychart;

    import android.graphics.Canvas;

    import com.github.mikephil.charting.components.XAxis;
    import com.github.mikephil.charting.renderer.XAxisRenderer;
    import com.github.mikephil.charting.utils.MPPointF;
    import com.github.mikephil.charting.utils.Transformer;
    import com.github.mikephil.charting.utils.Utils;
    import com.github.mikephil.charting.utils.ViewPortHandler;

    public class MyXAxisRenderer extends XAxisRenderer {

        public MyXAxisRenderer(ViewPortHandler viewPortHandler, XAxis xAxis, Transformer trans) {
            super(viewPortHandler, xAxis, trans);
        }

        @Override
        protected void drawLabels(Canvas c, float pos, MPPointF anchor) {
            //把代码复制过来
            final float labelRotationAngleDegrees = mXAxis.getLabelRotationAngle();
            boolean centeringEnabled = mXAxis.isCenterAxisLabelsEnabled();

            float[] positions = new float[mXAxis.mEntryCount * 2];

            for (int i = 0; i < positions.length; i += 2) {

                // only fill x values
                if (centeringEnabled) {
                    positions[i] = mXAxis.mCenteredEntries[i / 2];
                } else {
                    positions[i] = mXAxis.mEntries[i / 2];
                }
            }

            mTrans.pointValuesToPixel(positions);

            for (int i = 0; i < positions.length; i += 2) {

                float x = positions[i];

                if (mViewPortHandler.isInBoundsX(x)) {

                    String label = mXAxis.getValueFormatter().getFormattedValue(mXAxis.mEntries[i / 2], mXAxis);

                    if (mXAxis.isAvoidFirstLastClippingEnabled()) {

                        // avoid clipping of the last mXAxis.mEntryCount-1为x轴标签数
                        if (i == mXAxis.mEntryCount - 1 && mXAxis.mEntryCount > 1) {
                            float width = Utils.calcTextWidth(mAxisLabelPaint, label);

                            if (width > mViewPortHandler.offsetRight() * 2
                                    && x + width > mViewPortHandler.getChartWidth())
                                x -= width / 2;
                            // avoid clipping of the first
                        } else if (i == 0) {

                            float width = Utils.calcTextWidth(mAxisLabelPaint, label);
                            x += width / 2;
                            //重写该方法 添加的代码,x轴最后一个标签缩进
                        } else if (i == (mXAxis.mEntryCount - 1) * 2) {
                            float width = Utils.calcTextWidth(mAxisLabelPaint, label);
                            x -= width / 2;
                        }
                    }
                    drawLabel(c, label, x, pos, anchor, labelRotationAngleDegrees);
                }
            }

        }

    }
重写好了,在哪里使用呢?既然都看到这里,别急嘛,在往下看。
我们顺着XAxisRenderer找啊找啊,从BarLineChartBase->int()方法里面就有mXAxisRenderer,然后顺着这个方法找到了LineChart,LineChart->int()方法也有类似的XAxisRenderrer
Ok,那我们继承LineChart,然后重写int()就行了吧?
代码
    package com.mpandroidchartcsdn.mychart;

    import android.content.Context;
    import android.util.AttributeSet;

    import com.github.mikephil.charting.charts.LineChart;

    /**
     * Created by tujingwu on 2017/5/4
     * .
     */

    public class MyLineChart extends LineChart {

        public MyLineChart(Context context) {
            super(context);
        }

        public MyLineChart(Context context, AttributeSet attrs) {
            super(context, attrs);
        }

            @Override
        protected void init() {
            super.init();
            mXAxisRenderer = new MyXAxisRenderer(mViewPortHandler, mXAxis, mLeftAxisTransformer);
        }

    }
然后我们像使用LineChart,使用MyLineChart看看
结果
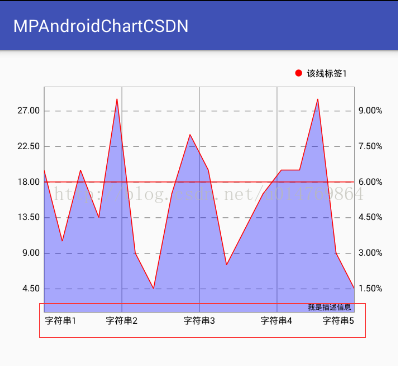
恩,没什么问题了看起来(这只是一个简单的demo,丑不丑的别再意,客官们),对于开头gif里的左右和底部的markerview在下一篇实现。

[...]对于MPAndroidChart的基本属性和一些常见的设置前面的一篇博客MPAndroidChart之LineChart(1) http://www.ramlife.org/2021/12/05/479.html 大部分说到了,这篇将要实现MarkerView这个东西,我理解是提示覆盖物,类似百度地图的覆盖物同一个意思,至于其他啥啥的,可以评论里吐口水大笑。[...]
[...]在最新版本里(当前是3.0.2),LineChart设置好基础属性后(如果基本设置和属性不懂的可以看看 MPAndroidChart 之LineChart(1) ),http://www.ramlife.org/2021/12/05/479.html 在按上面代码其中之一进行设置缩放3f后(这里为了简单些,只缩放X轴),效果图如下:[...]