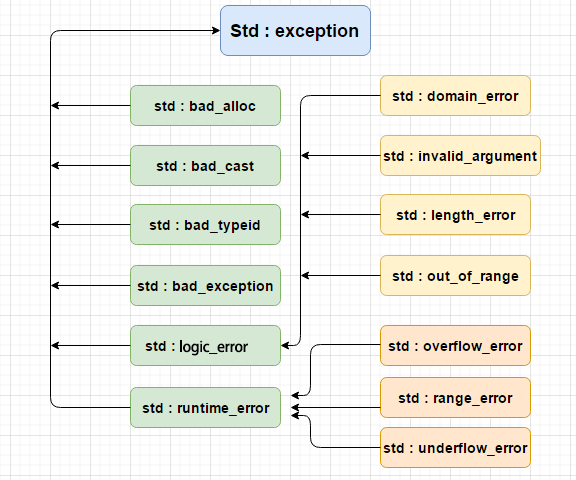
异常分为很多种,可以参考下图
打印堆栈信息, 需要编译时增加参数 -rdynamic
打印堆栈信息主要是依靠一下几个函数:
#include <execinfo.h>

int backtrace(void **buffer, int size);
char **backtrace_symbols(void *const *buffer, int size);
void backtrace_symbols_fd(void *const *buffer, int size, int fd);
示例代码如下:
#include <iostream>
#include <execinfo.h>

void test_backtrace(){
  const int maxFrames = 100;                            // 堆栈返回地址的最大个数
  void *frame[maxFrames];                               // 存放堆栈返回地址
  int nptrs = backtrace(frame, maxFrames);
  char **strings = backtrace_symbols(frame, nptrs);   // 字符串数组
  if(strings == nullptr){
    return;
  }

  for(int i = 0; i < nptrs; ++ i){
    std::cout << strings[i] << '\n';
  }

  free(strings);
}

int main(){
  test_backtrace();

  return 0;
}
终端:
$ g++ -o test.out -rdynamic backtrace.cpp
$ ./test.out
./test.out(_Z14test_backtracev+0x38) [0x7f4819400bb2]
./test.out(main+0x9) [0x7f4819400c5a]
/lib/x86_64-linux-gnu/libc.so.6(__libc_start_main+0xe7) [0x7f4818691b97]
./test.out(_start+0x2a) [0x7f4819400a9a]
把 cpp 的函数名转为正常的函数名
#include <cxxabi.h>
char* abi::__cxa_demangle(const char *mangled_name, char *output_buffer, size_t *length, int *status)
示例代码:
void test_backtrace(){
  const int maxFrames = 100;                            // 堆栈返回地址的最大个数
  void *frame[maxFrames];                               // 存放堆栈返回地址
  int nptrs = backtrace(frame, maxFrames);
  char **strings = backtrace_symbols(frame, nptrs);     // 字符串数组
  if(strings == nullptr){
    return;
  }

  size_t len = 256;
  char *demangled = static_cast<char*>(::malloc(len));  // 用于存放demangle之后的结果
  for(int i = 0; i < nptrs; ++ i){
    char *leftPar = nullptr;                            // 左括号
    char *plus = nullptr;                               // 加号
    for(char *p = strings[i]; *p; ++ p){                // 找到左括号和加号的位置,两者之间的内容是需要demangle的
      if(*p == '(')
        leftPar = p;
      else if(*p == '+')
        plus = p;
    }

    *plus = '\0';
    int status = 0;
    char *ret = abi::__cxa_demangle(leftPar+1, demangled, &len, &status);
    *plus = '+';
    if(status != 0){
      std::cout << strings[i] << '\n';
    }
    else{
      demangled = ret;
      std::string stack;
      stack.append(strings[i], leftPar+1);
      stack.append(demangled);
      stack.append(plus);
      std::cout << stack << '\n';
    }
  }

  free(demangled);
  free(strings);
}
输出:
$ g++ -o test.out -rdynamic backtrace.cpp
$ ./test.out
./test.out(test_backtrace()+0x39) [0x7fb9c34013a3]
./test.out(main+0x9) [0x7fb9c340165f]
/lib/x86_64-linux-gnu/libc.so.6(__libc_start_main+0xe7) [0x7fb9c2671b97]
./test.out(_start+0x2a) [0x7fb9c340128a]
封装为异常类
Exception.h
#ifndef EXCEPTION_H_
#define EXCEPTION_H_

#include <stdexcept>

class Exception : public std::runtime_error
{
public:
  Exception(const std::string &what);
  ~Exception() noexcept override = default;

  std::string stack_trace() const noexcept {
    return m_stack;
  }

private:
  void fill_stack_trace();

private:
  std::string m_stack;
};

#endif // EXCEPTION_H_
Exception.cpp
#include <cxxabi.h>     // __cxa_demangle
#include <execinfo.h>   // backtrace backtrace_symbols

#include "Exception.h"

Exception::Exception(const std::string &what) :
  std::runtime_error(what)
{
  fill_stack_trace();
}

void Exception::fill_stack_trace(){
  const int maxFrames = 200;                            // 返回堆栈框架的最大个数
  void *frame[maxFrames];                               // 存放堆栈框架的的返回地址
  int nptrs = ::backtrace(frame, maxFrames);
  char **strings = ::backtrace_symbols(frame, nptrs);   // 字符串数组
  if(strings == nullptr){
    return;
  }

  size_t len = 256;
  char *demangled = static_cast<char*>(::malloc(len));  // 用于存放demangled之后的结果
  for(int i = 1; i < nptrs; ++ i){
    char *leftPar = nullptr;                            // 左括号
    char *plus = nullptr;                               // 加号
    for(char *p = strings[i]; *p; ++ p){                // 找到左括号和加号的位置,两者之间的内容是需要demangle的
      if(*p == '(')
        leftPar = p;
      else if(*p == '+')
        plus = p;
    }

    *plus = '\0';
    int status = 0;
    char *ret = abi::__cxa_demangle(leftPar+1, demangled, &len, &status);
    *plus = '+';
    if(status != 0){
      m_stack.append(strings[i]);
    }
    else{
      demangled = ret;
      m_stack.append(strings[i], leftPar+1);
      m_stack.append(demangled);
      m_stack.append(plus);
    }

    m_stack.push_back('\n');
  }

  free(demangled);
  free(strings);
}
测试代码:
#include <iostream>
#include <tools/base/Exception.h>

class ExceptionTest{
public:
  ExceptionTest(){
    throw Exception("hello world");
  }
};

void test_func(){
  ExceptionTest b;
}

int main(){
  try{
    test_func();
  }
  catch(Exception &e){
    std::cout << e.what() << '\n';
    std::cout << e.stack_trace() << std::endl;
  }

  return 0;
}
输出:
$ g++ -o Exception_test -rdynamic Exception_test.cpp
$ ./Exception_test
hello world
./Exception_test(Exception::Exception(std::__cxx11::basic_string<char, std::char_traits<char>, std::allocator<char> > const&)+0x4e) [0x7f7e06a020f4]
./Exception_test(ExceptionTest::ExceptionTest()+0x5d) [0x7f7e06a01fe5]
./Exception_test(test_func()+0x23) [0x7f7e06a01ddd]
./Exception_test(main+0x1d) [0x7f7e06a01e11]
/lib/x86_64-linux-gnu/libc.so.6(__libc_start_main+0xe7) [0x7f7e05c71b97]
./Exception_test(_start+0x2a) [0x7f7e06a01cda]
参考: https://blog.csdn.net/sdjn_lyn/article/details/103791142
https://stackoverflow.com/questions/8623884/gcc-debug-symbols-g-flag-vs-linkers-rdynamic-option
https://www.cnblogs.com/LiuYanYGZ/p/5550544.html
https://www.cnblogs.com/lidabo/p/4545639.html
查找对应的行
可以使用 addr2line 这个工具来根据对应的地址查找相应的行。但是需要编译的时候,使用 -g 选项。
但是直接使用上面的 0x7f7e06a01fe5 这样的长地址会有问题, addr2line 输出的是 ??:0,经过对比网上的文档里面的地址都是类似于这样 400526的地址。
经过长时间搜索发现,短地址那个基本是静态编译,编译时候使用 -static,输出结果就是短地址了,长地址使用了动态编译。 当然还有另外一种说法是,链接的库使用的是没有符号表的,所以会这样。还有说法是,运行的时候输出的时运行时地址,这个地址是 MMU 处理过的,使用 addr2line 并不是运行时,这个地址已经无效了。
参考: https://my.oschina.net/u/4000302/blog/3081293
https://blog.csdn.net/qq_25333681/article/details/99689959
addr2line 使用参数 -f 显示函数名称, -C 可以解析函数为正常名称,-e 指定执行二进制文件。
readelf -a your_exe | grep your_func 先查看具体函数对应的地址。也可以使用 nm -C your_exe | grep your_func 来查看函数对应的地址。 `objdump -DS your_exe | grep -6 "40a3" 类似这样可以查看具体地址对应的汇编代码。
使用如下:
./Exception(test_func()+0x23) [0x556af2926f4d]使用 nm -C Exception | grep test_func
00000000000022b4 t _GLOBAL__sub_I__Z9test_funcv
0000000000001f2a T test_func()
然后 0x1F2A + 0x23 = 1F4D, 再用 addr2line -fCe Exception 0x1F4D 就可以看到输出了:
test_func()
/home/ptz/test_cpp/exception/Exception_test.cpp:15
参考: https://ubuntuforums.org/showthread.php?t=2418651
剥离调试信息
可以在本地使用 -g 参数生成带调试信息的二进制文件,发布出去的可以是去除调试信息的,使用命令 objcopy --strip-all exe-debug exe-striped, 这样当收到错误信息时,直接在本地使用 addr2line 来查找到对应的出错地址。
参考: http://rockhong.github.io/backtrace-and-addr2line.html
还可以考虑使用 libbfd,但是比较麻烦。 参考: https://blog.csdn.net/crazycoder8848/article/details/51456297
使用信号
在代码里面增加:
#include <csignal>

void sighandler_dump_stack(int sig)
{
        psignal(sig, "handler");
        //dump_stack();
        auto e = Exception("signal exception");
        std::cout << "what: " << e.what() << std::endl;
        std::cout << "trace: " << e.stack_trace() << std::endl;
        signal(sig, SIG_DFL);
        raise(sig);
}

void func_c()
{
        *((volatile int *)0x0) = 0x9999; /* ERROR */
}

int main(){
  if (signal(SIGSEGV, sighandler_dump_stack) == SIG_ERR)
          perror("can't catch SIGSEGV");

  func_c();

  return 0;
}
参考: https://www.cnblogs.com/sunowfox/p/6860588.html
https://cloud.tencent.com/developer/section/1009556
https://blog.csdn.net/gatieme/article/details/84189280
__builtin_return_address(level) 可以输出地址
参数为 0 的时候,打印当前函数,参数为 1,打印调用函数。 参考: http://abcdxyzk.github.io/blog/2013/11/20/lang-c-buildin-addr/
参考:
https://www.runoob.com/cplusplus/cpp-exceptions-handling.html
https://www.cnblogs.com/lidabo/p/3635646.html
https://blog.csdn.net/u014608280/article/details/84974877
https://docs.microsoft.com/zh-cn/cpp/cpp/exception-specifications-throw-cpp?view=msvc-160
https://www.cnblogs.com/yangguang-it/p/6435297.html
https://blog.csdn.net/ab0902cd/article/details/107842903
https://www.cs.usfca.edu/~benson/cs326/pintos/bin/backtrace
https://unix.stackexchange.com/questions/561483/forking-addr2line-on-shared-object-from-application-for-constructing-stack-tra
https://blog.csdn.net/matafeiyanll/article/details/109913503
https://stackoverflow.com/questions/51595071/addr2line-returns-0-even-when-compiled-with-g3-gdb-backtrace-works
https://www.cnblogs.com/sky-heaven/p/9239329.html
https://linxiaohui.gitbooks.io/linux-devp-guide/content/runtime/func.html
https://www.cnblogs.com/arnoldlu/p/11607916.html
https://blog.csdn.net/salmonwilliam/article/details/113977762
